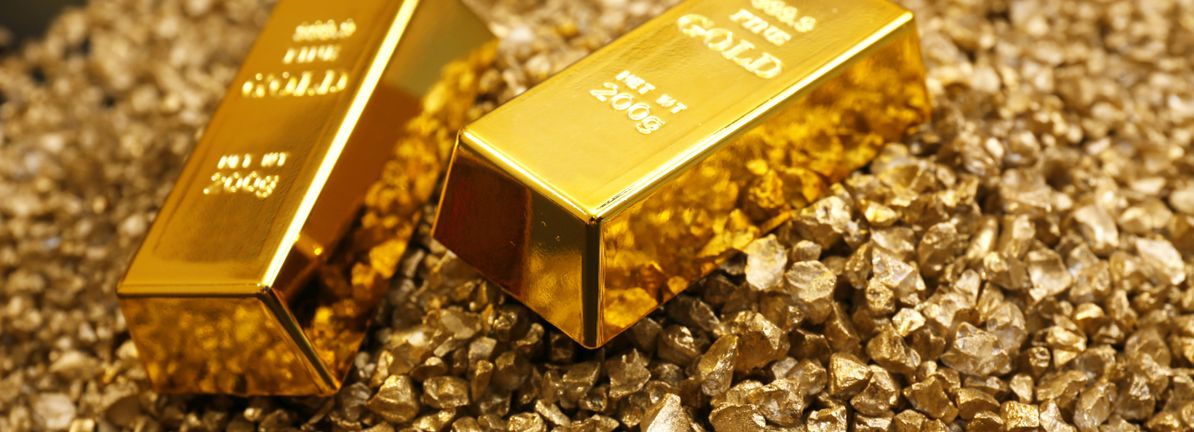
Barrick Mining

Trade Barrick Mining 24 hours a day, five days a week on Robinhood.
Robinhood gives you the tools to revolutionize your trading experience. Use the streamlined mobile app, or access advanced charts and execute precise trades on our browser-based platform, Robinhood Legend. Risks and limitations apply.About B
Barrick Mining Corp. engages in the production and sale of gold, copper, and related activities. It also provides exploration and mining development.
B Key Statistics
Stock Snapshot
Barrick Mining(B) stock is priced at $36.75, giving the company a market capitalization of 66.29B. It carries a P/E multiple of 10.02 and pays a dividend yield of 2.51%.
On 2026-08-01, Barrick Mining(B) stock moved within a range of $36.19 to $37.26. With shares now at $36.75, the stock is trading +1.5% above its intraday low and -1.4% below the session's peak.
Trading activity shows a volume of 6.27M, compared to an average daily volume of 7.28M.
The stock's 52-week range extends from a low of $21.13 to a high of $54.69.
The stock's 52-week range extends from a low of $21.13 to a high of $54.69.
B News
...

Barrick Mining has delivered a strong 135.5% return over the past 3 years, yet today's valuation picture is mixed, with the Discounted Cash Flow (DCF) intrinsic...
Analyst ratings
77%
of 26 ratingsPeople also own
Similar Marketcap
This list is generated by looking at the six larger and six smaller companies by market cap in relation to this company.
Popular Stocks
This list is generated by looking at the top 100 stocks and ETFs most commonly held by Robinhood customers and showing a random subset
Newly Listed
This list is generated by showing companies that recently went public.