A practical guide for bubble watchers
A practical guide for bubble watchers


Unless you’ve been off the grid, you’ve probably heard the word “bubble” pop up recently in the same sentence as AI.
It’s beyond obvious that AI has taken over the market and economic activity. Every week brings a new megaproject, record valuation, or bold prediction about technology reshaping the world. But as time goes on, it’s hard to tell whether it’s genuine or whether we’re in a bubble. Because, you don’t know if you’re in one for sure—until it pops.
The AI boom
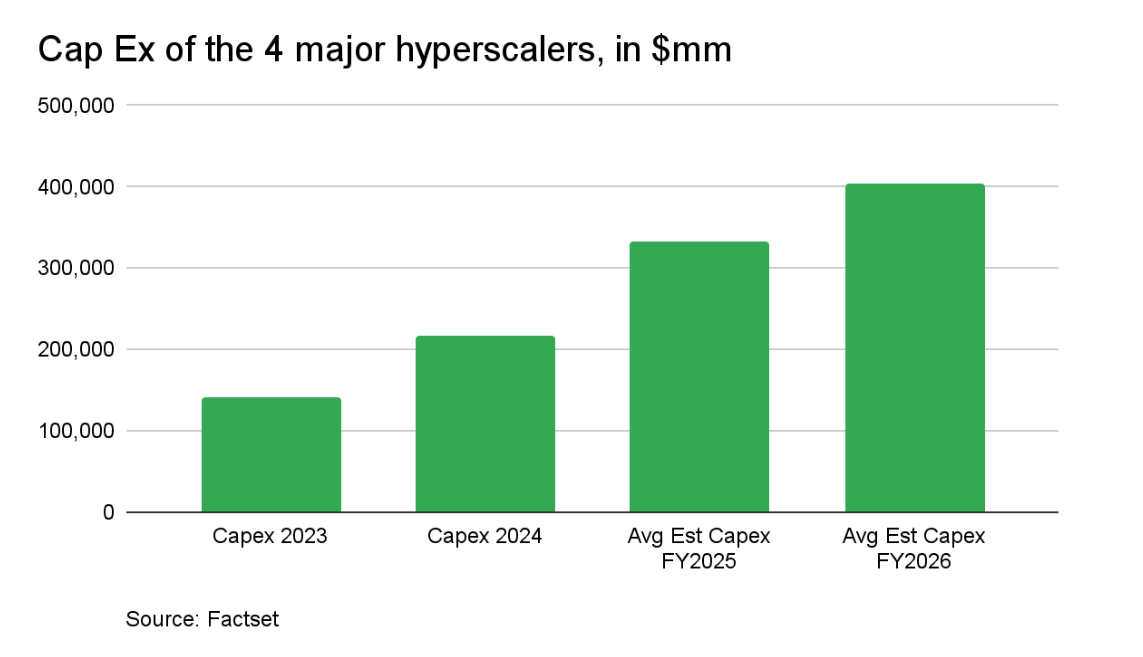
The race to dominate artificial intelligence has unleashed one of the largest corporate spending waves in history—tech giants and giants in the making (OpenAI, xAI) are pouring hundreds of billions into chips, data centers, and energy infrastructure. The top four “hyperscalers” alone are expected to spend nearly $400 billion on capital investments next year—double the amount in 2024. To put the size of the spend in context, over just a few years, AI infrastructure spending has already surpassed the inflation-adjusted cost of building the entire US interstate highway system.
According to a recent piece by Bain & Co, this build-out could require $2 trillion in annual AI revenue by 2030 to break even. Current annual AI revenue is roughly $45 billion. That gap reflects the defining tension of the AI era: extraordinary promise, but limited payoff—so far.
Of course, tech leaders argue this investment is essential. Miss this wave, and risk becoming the next Nokia. Yet the capital intensity of this moment is striking.
So is it a boom or a bubble? And is history repeating itself (from 1999)?
The parallels to the dot-com and fiber-optic booms are understandable because at that time there was also exponential infrastructure build-out, limited immediate revenue (and in some cases none!), and leverage. One academic study (Devil Take the Hindmost: A History of Financial Speculation) found that in a sample of 51 major innovations introduced between 1825 and 2000, bubbles in equity prices were evident in 73% of the cases.
So we picked some metrics to create a “bubble watch”: Valuations, Financing, and IPO market
Valuations: Bubbles can form when prices and valuations surge beyond plausible future cash flows.
What to track: metrics such as sector and stock forward P/Es, and PEG ratios (P/E ÷ EPS growth)
For example, based on history*, if PEG trends >3 or forward P/E approaches ~50x, that’s bubble-like. For tech, the dot-com peaks were ~2× today’s median forward P/E for leaders in the sector. PEG hit ~3.7 then vs. ~1.7 now.
Rating: 🟢
Who’s financing the boom: Historically, bubbles become fragile when heavy debt funds capex.
What to track: Capex/FCF for hyperscalers, rising net debt/leverage, and credit issuance tied to data centers/vendor financing. If capex/FCF climbs back toward late-1990s style levels and debt/vendor financing accelerates broadly, systemic risk rises.
The surge in capex has mostly been funded by free cash flow. But there has been a recent tilt toward debt/vendor financing. Goldman Sach’s TMT AI basket, which tracks equities that are either pursuing artificial intelligence or can help enable the technology, shows these companies have issued $141 billion in corporate debt in 2025, more than all of their supply in 2024 of $127 billion. This trend looks likely to continue because:
First cash balances among large tech firms have declined to levels almost in-line with the median non-financial company.
Second, the appetite for spending remains strong, with capex growth anticipated to reach a solid 50% on a year-over-year basis, through 2025.
Rating: 🟡 While not yet a cause for alarm, given both the high cashflow generation and low leverage among large tech companies, the shifting funding mix of capex beyond cash is worth monitoring.
Hot IPOs:
What to track: Tech IPO count & proceeds, first-day IPO returns.
Why: A sustained spike in IPO volume + extreme first-day pops and broad secondary issuance to fund capex can be a late-cycle tell.
IPO/M&A are starting to accelerate. There has been an 18% increase* in the number of IPOs vs. the same period in 2024—the strongest year since 2021. But these numbers are from very low levels. And the starting day premiums for IPOs has reached ~30% in the US—the highest since the late-1990s.
Rating: 🟡/🟢Rising but still well below the historical average volume of issuance (post-2000 median is 104).
To bubble or not to bubble: right now, the truth likely lies somewhere in between. AI could eventually become a bubble, but it’s also sure to transform the world. Importantly, investors don’t need to call the top. They just need to recognize when enthusiasm turns into excess.
*Based on a report from Goldman Sachs using data from Factset.