Hi, it’s not me: Waning affordability as a result of policy
Hi, it’s not me: Waning affordability as a result of policy


Thanksgiving can be a nice break. If you’re fortunate enough, it means time with those we care about, without the pressure of gifts. But like any gathering with extended family, it can also mean you stumble into a conversation you’d sooner prefer to leave, in the name of peace.
I recently shared a post from Michael Green with my family (Part 1: My Life is Lie), because it was so interesting. In it, he discusses the 1965 definition of the poverty line, how it was intended to measure income inadequacy vs. income adequacy, and then goes on to detail what his real measure of adequacy for a family might be now. Worth a read.
I soon learned, though, one family member’s main takeaway from it: the increase of women’s participation in the workforce is why the cost of living increased over the decades.
As one of those actual women in the workforce, it was hard to understand why they would share that with me of all people (maybe they forgot?).
Needless to say, I quickly departed the discussion in the name of chopping up a salad for dinner, making a mental note to look at the data after the weekend. This eventually led to many data points related to the cost of living. Let’s get to it.
Labor’s share of income has been declining for decades, and it’s not because women went to work.
For nearly half a century, workers have captured a shrinking share of economic output. Labor’s share of income (green line) has trended downward since the late 1970s, but really took a dive around the year 2000. Meanwhile, you can also see women’s labor force participation (black line) rose steadily until about 2000, staying about the same since.
Falling affordability isn’t about more women working—it’s about wages capturing less of national income over time. This erosion in labor share created a backdrop for everything else: households needed two incomes not because lifestyle expectations changed, but because one income no longer went as far.
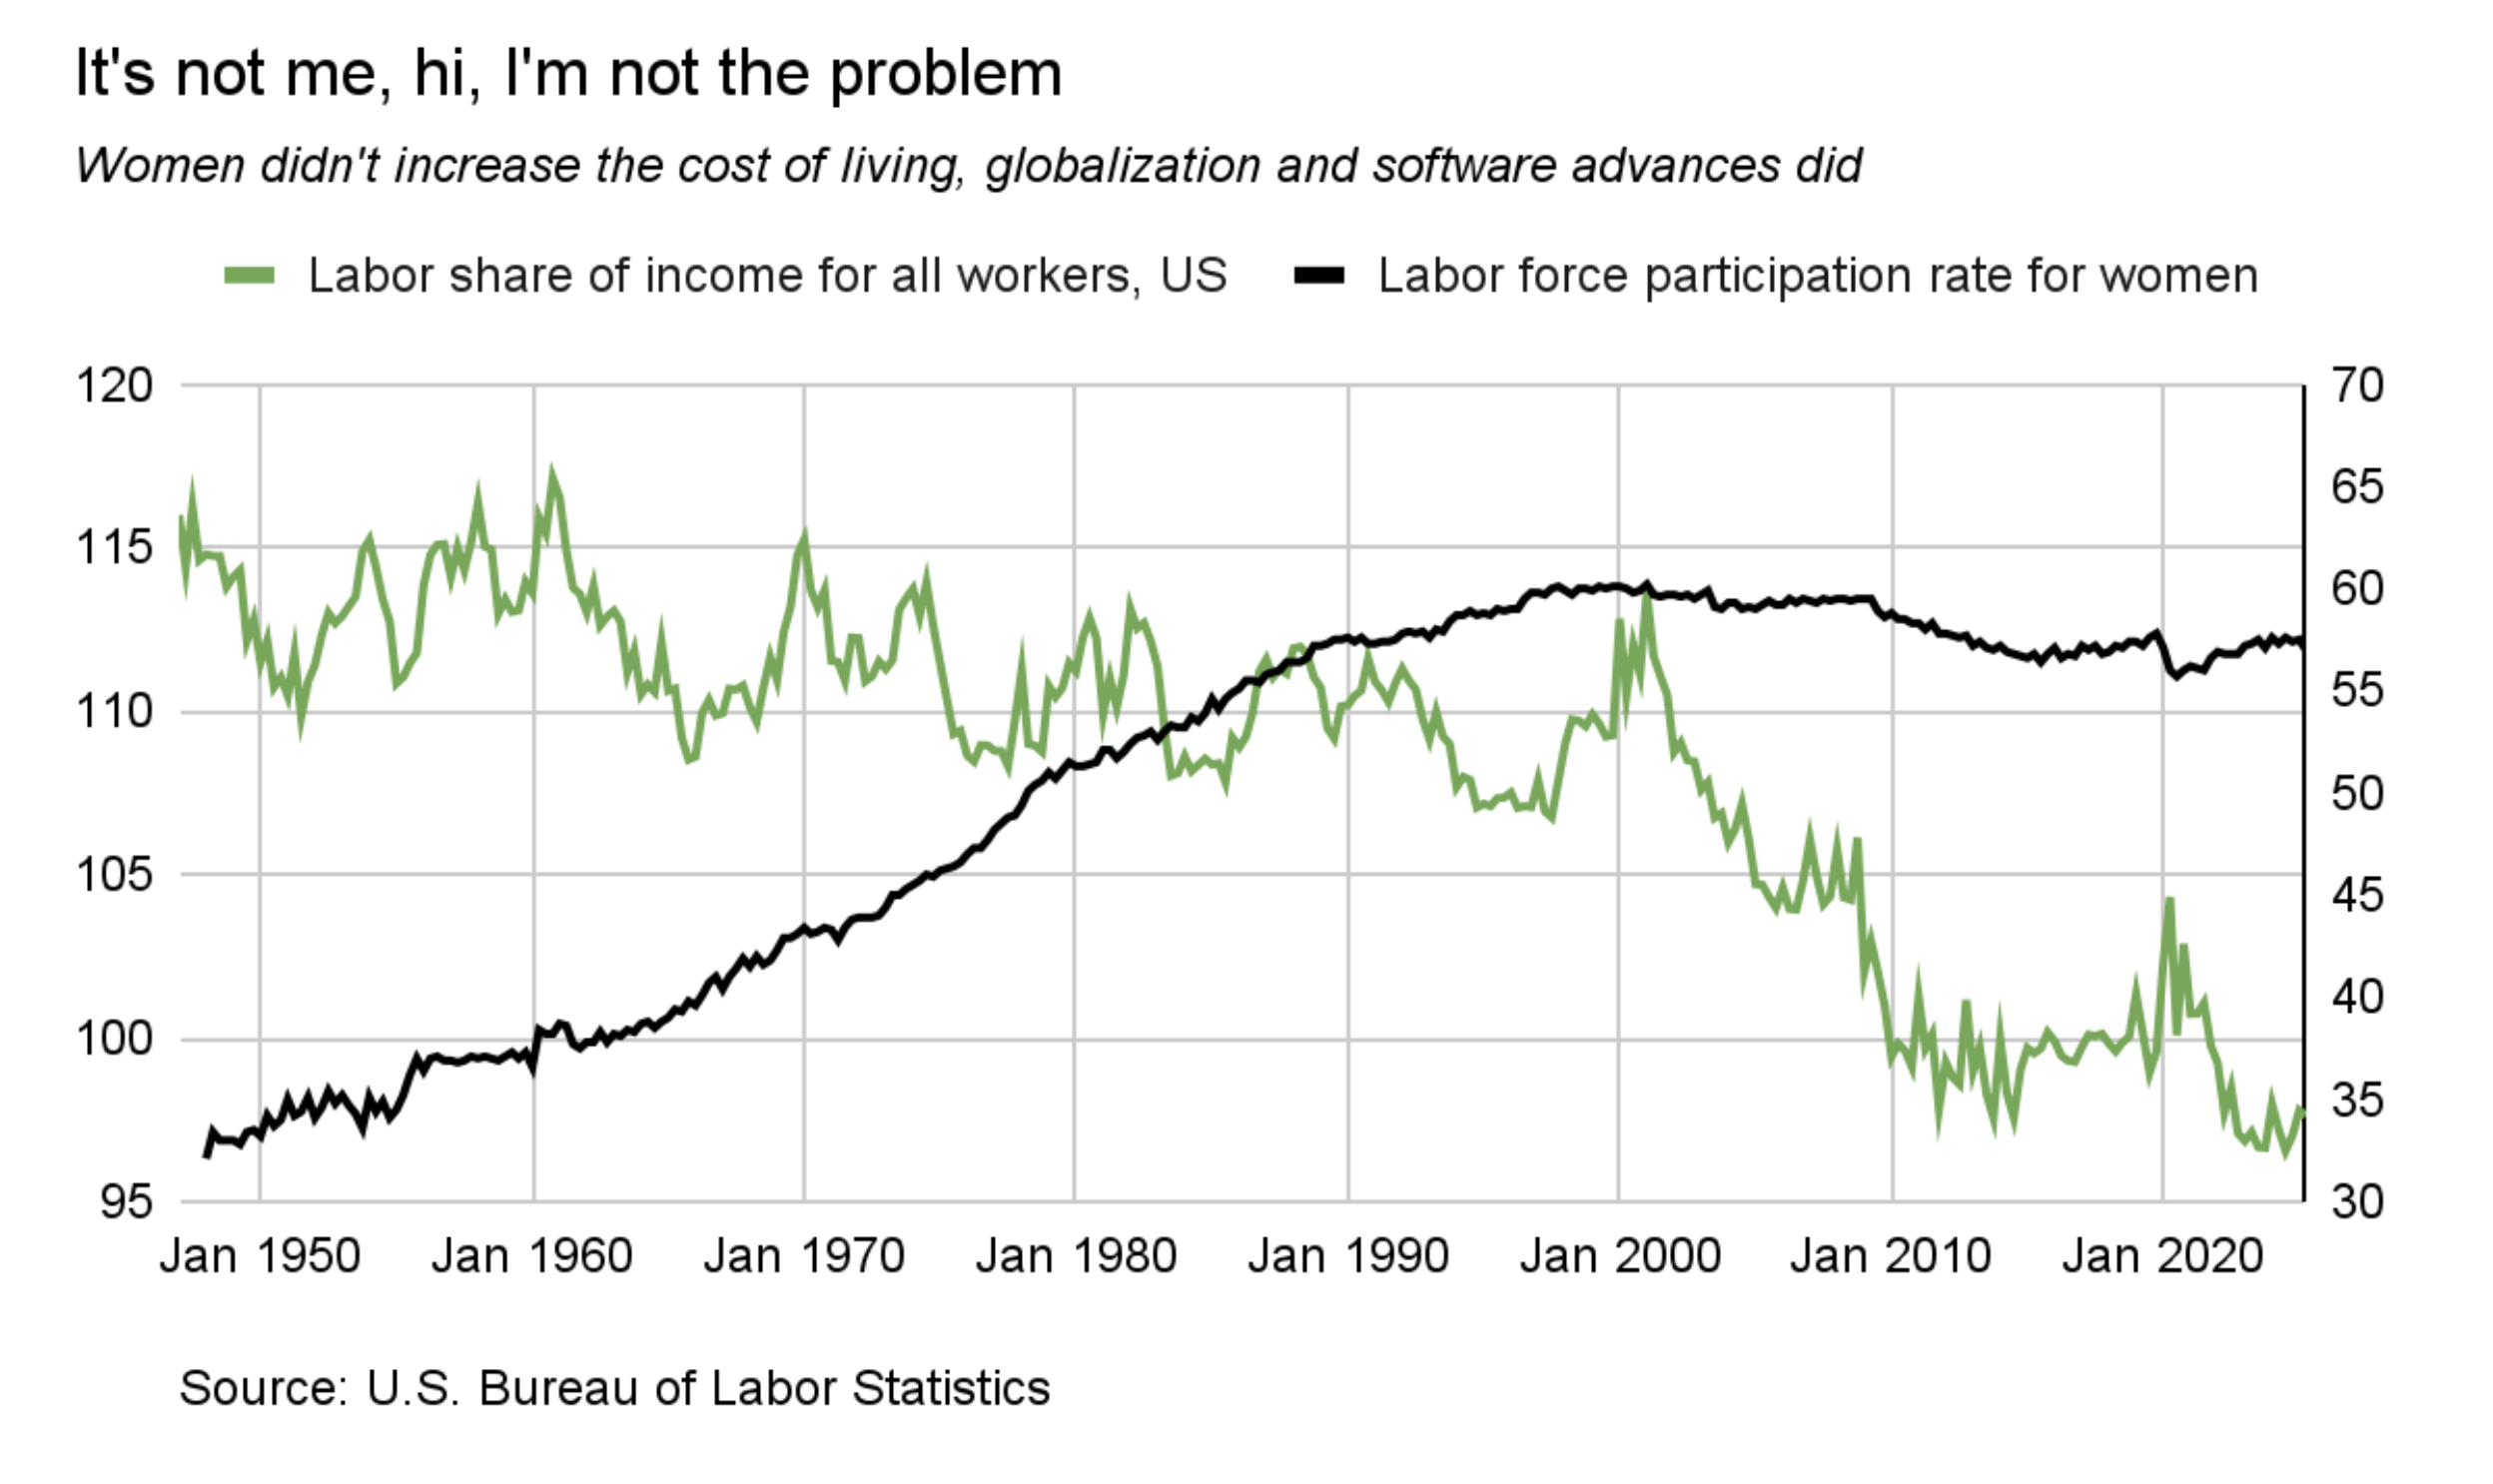
Why did income share start to really drop around the year 2000? Most people would guess it was thanks to globalization and the moving of jobs offshore in the name of company margins. While that is partially true, especially given this is around the same time China joined the World Trade Organization, a Fed paper from 2020 explained a larger share was from the growing adoption of software. Software made work more efficient, especially in service industries with cognitive-intensive occupations, where less people were needed to achieve the same production. AI will likely continue this trend. Something to be aware of—making investing what you can even more important.
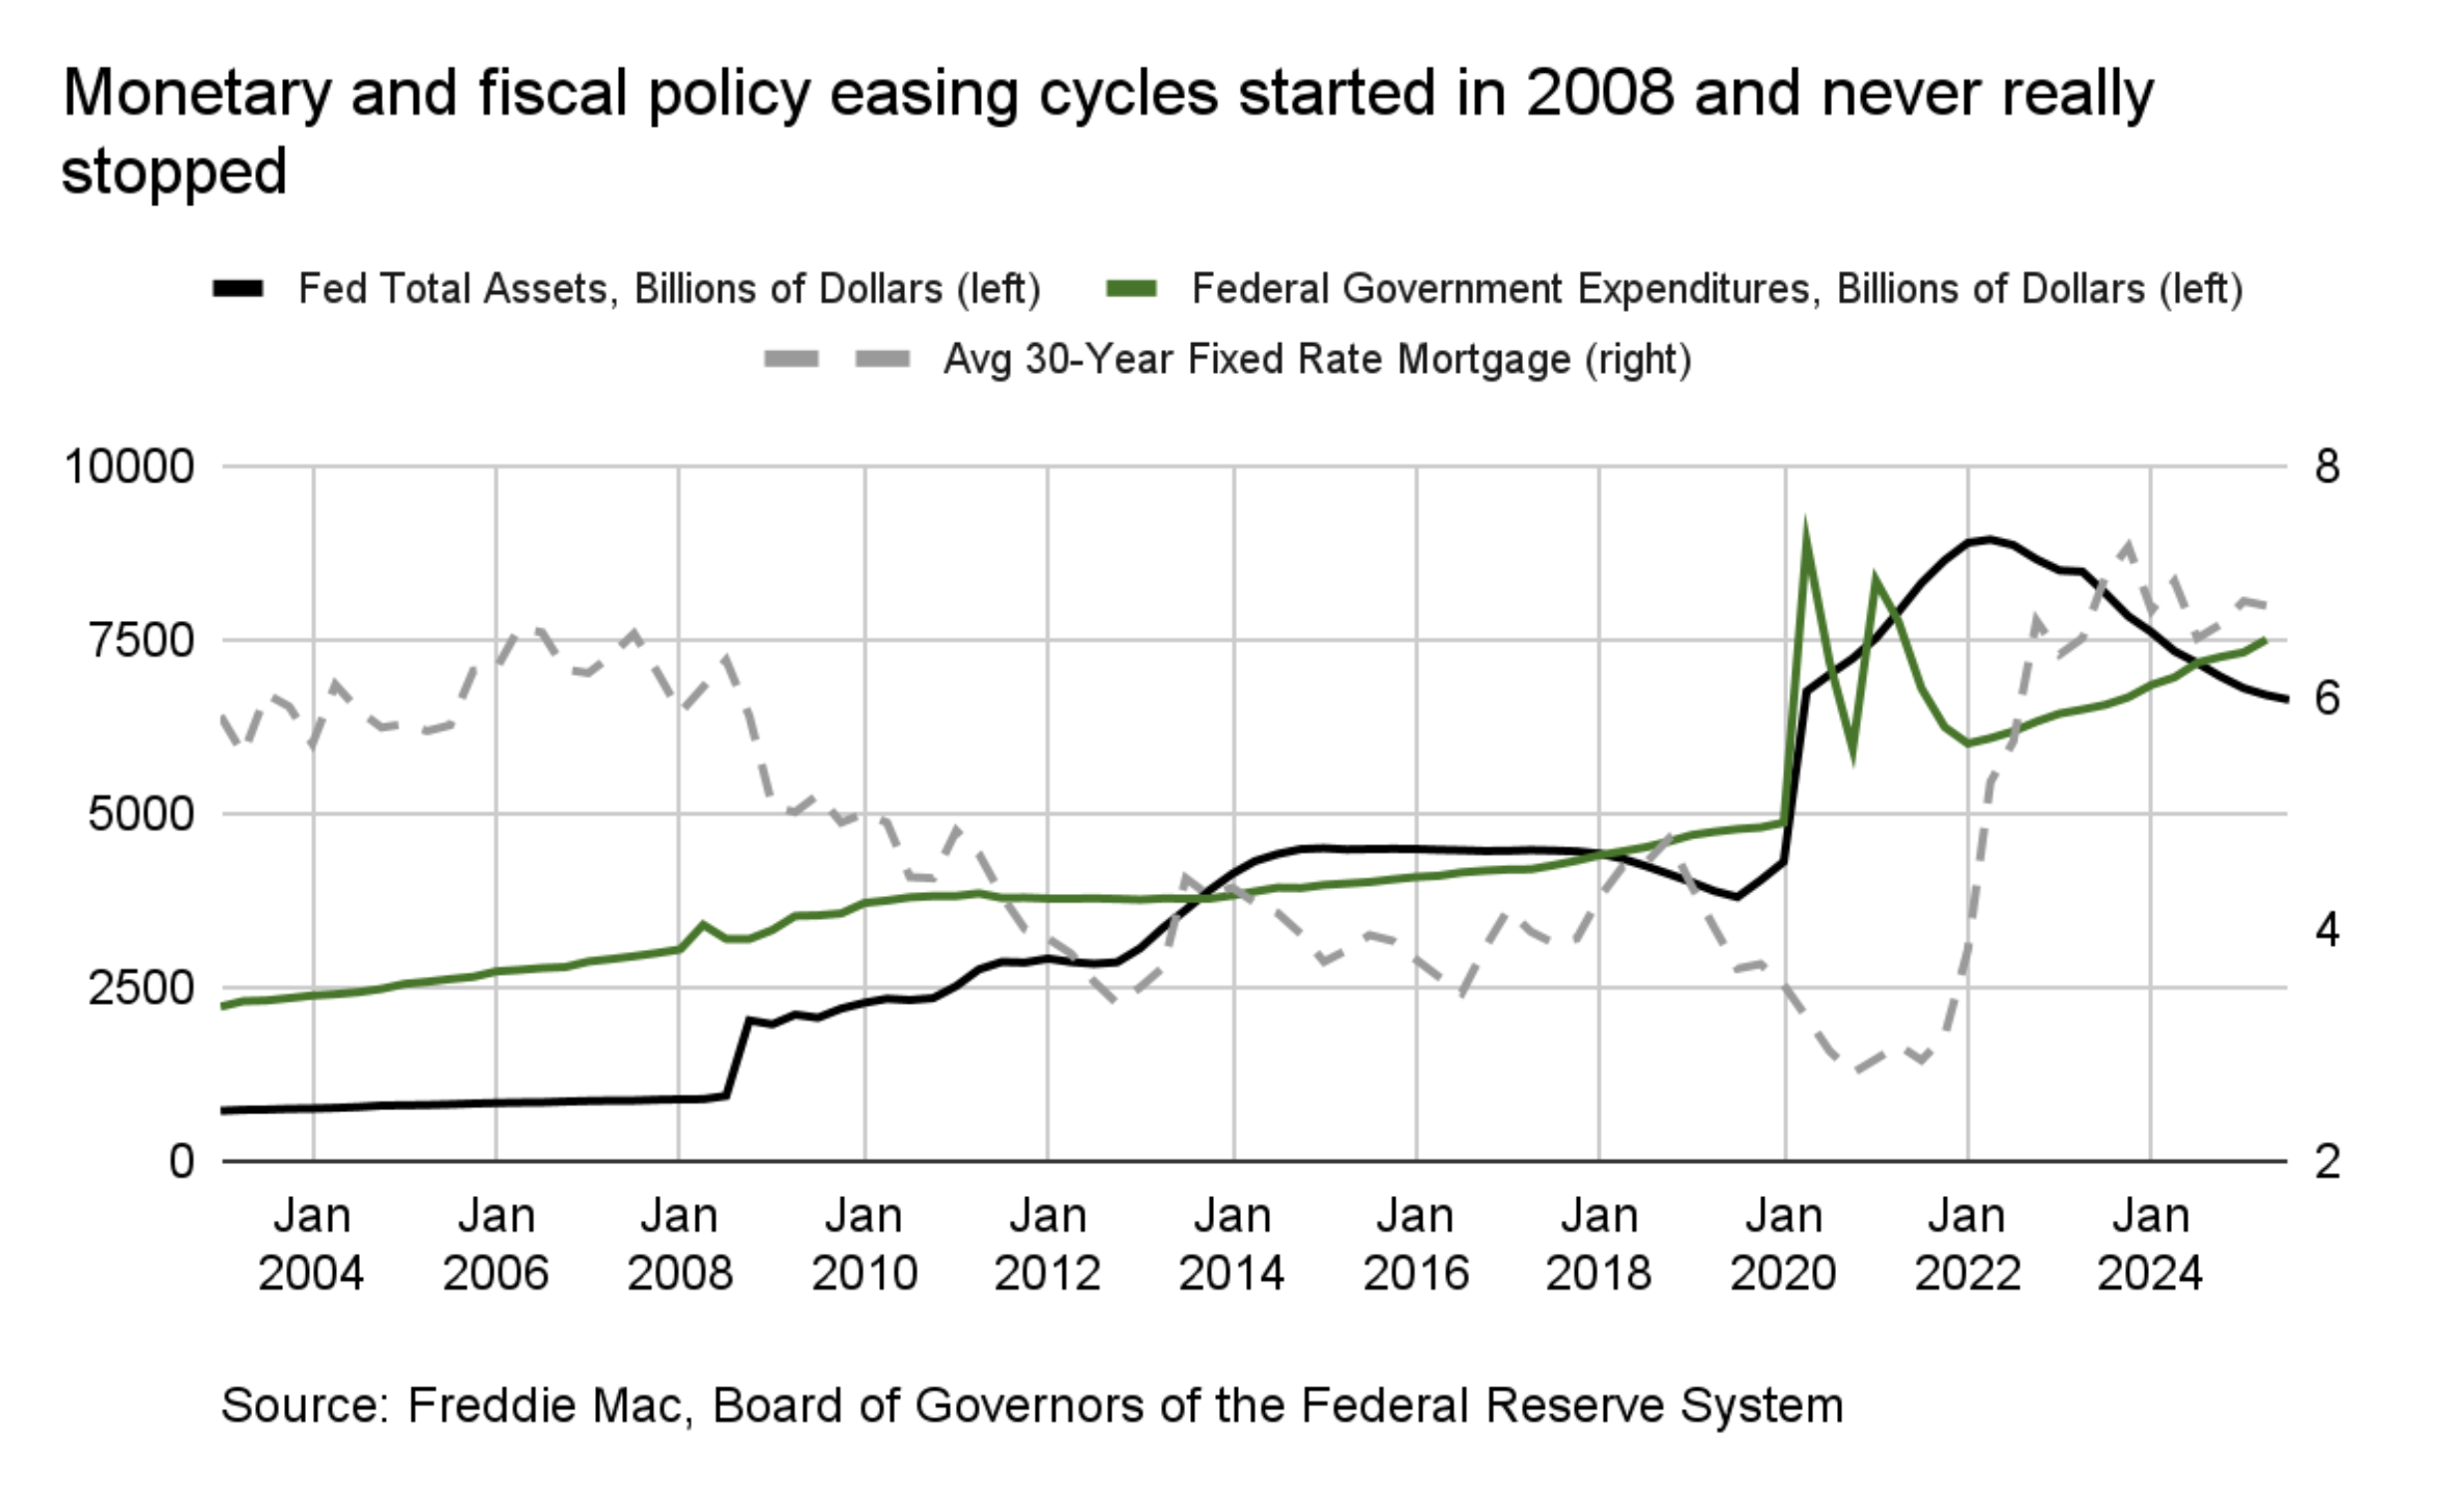
2. Monetary and fiscal policy supercharged asset growth, especially home prices.
The 2008 financial crisis ushered in a new era of aggressive monetary and fiscal intervention—then, when Covid hit, new policies said “hold my beer.”
The Federal Reserve’s balance sheet expanded from ~$1T to nearly $5T from 2008 to 2014. Then, in 2020, it expanded to ~$9T.
Federal government expenditures also moved substantially higher in 2020 from ~$5T to $9T.
Low Fed Funds interest rates and quantitative easing to reduce longer term rates became ongoing, not temporary. Mortgage rates dropped from around 6% pre-2008 to as low as 3% in 2021.
This environment of stimulus boosted asset prices—homes, equities, and other financial assets—much faster than wages. From 1988 through 2012, the median home sale price grew by about 4% per year. From 2012 through 2019, it grew by about 6% per year. And since 2019, it has grown by nearly 15% per year! Liquidity became the primary tool for stabilizing the economy, but it also amplified the gap between asset owners and everyone else.
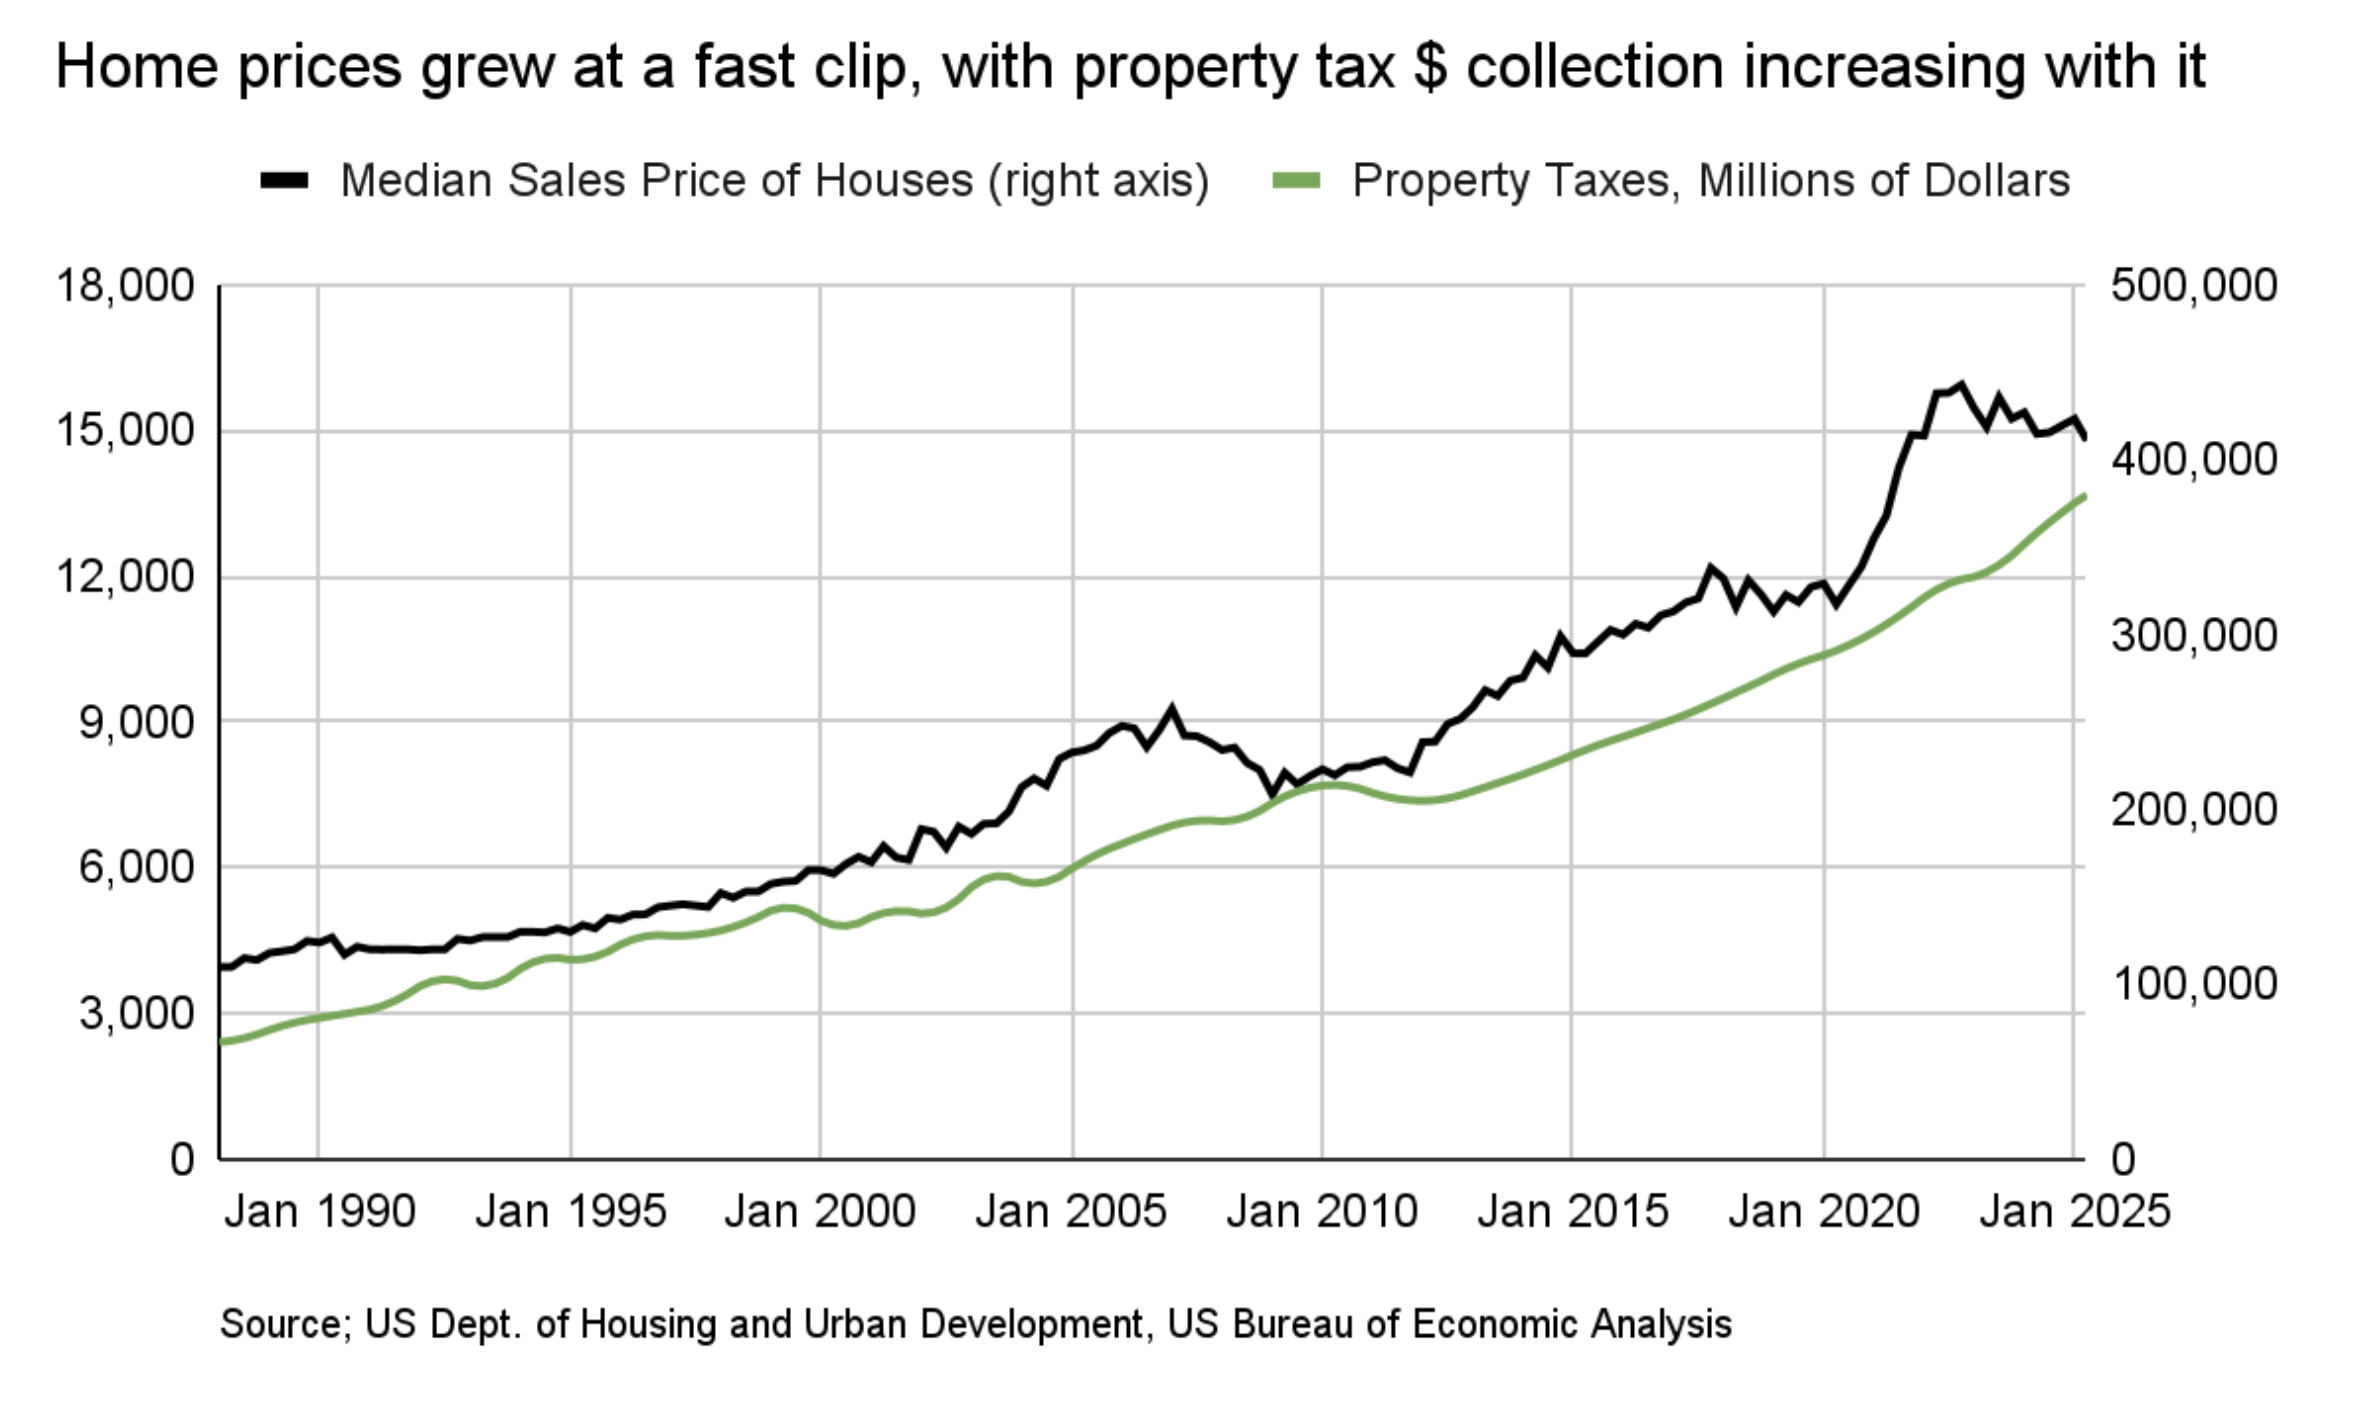
Finally, property taxes are a function of property values. You can see while property taxes have become an increasing part of a family’s costs in home ownership, it’s really because property prices shot up.
This means households face a dual burden:
It’s more expensive to buy a home.
It’s more expensive to own a home.
Even if a family stays put, rising valuations and tax assessments steadily increase the cost of living. Not to mention potential childcare costs.
3. Suppressed rates reshaped expectations and amplified price pressures
Years of near-zero interest rates and quantitative easing fundamentally changed expectations around what “normal” borrowing costs should look like.
Mortgage rates trended downward for decades.
The Federal Funds rate stayed near zero through multiple cycles.
Consumer Price Index (CPI) remained subdued until the 2021, allowing loose policy to persist.
When inflation surged in 2021–2022, rates rose sharply but home prices stayed elevated. This combination created the most challenging affordability environment since the early 1980s, only without the wage growth that characterized earlier cycles.
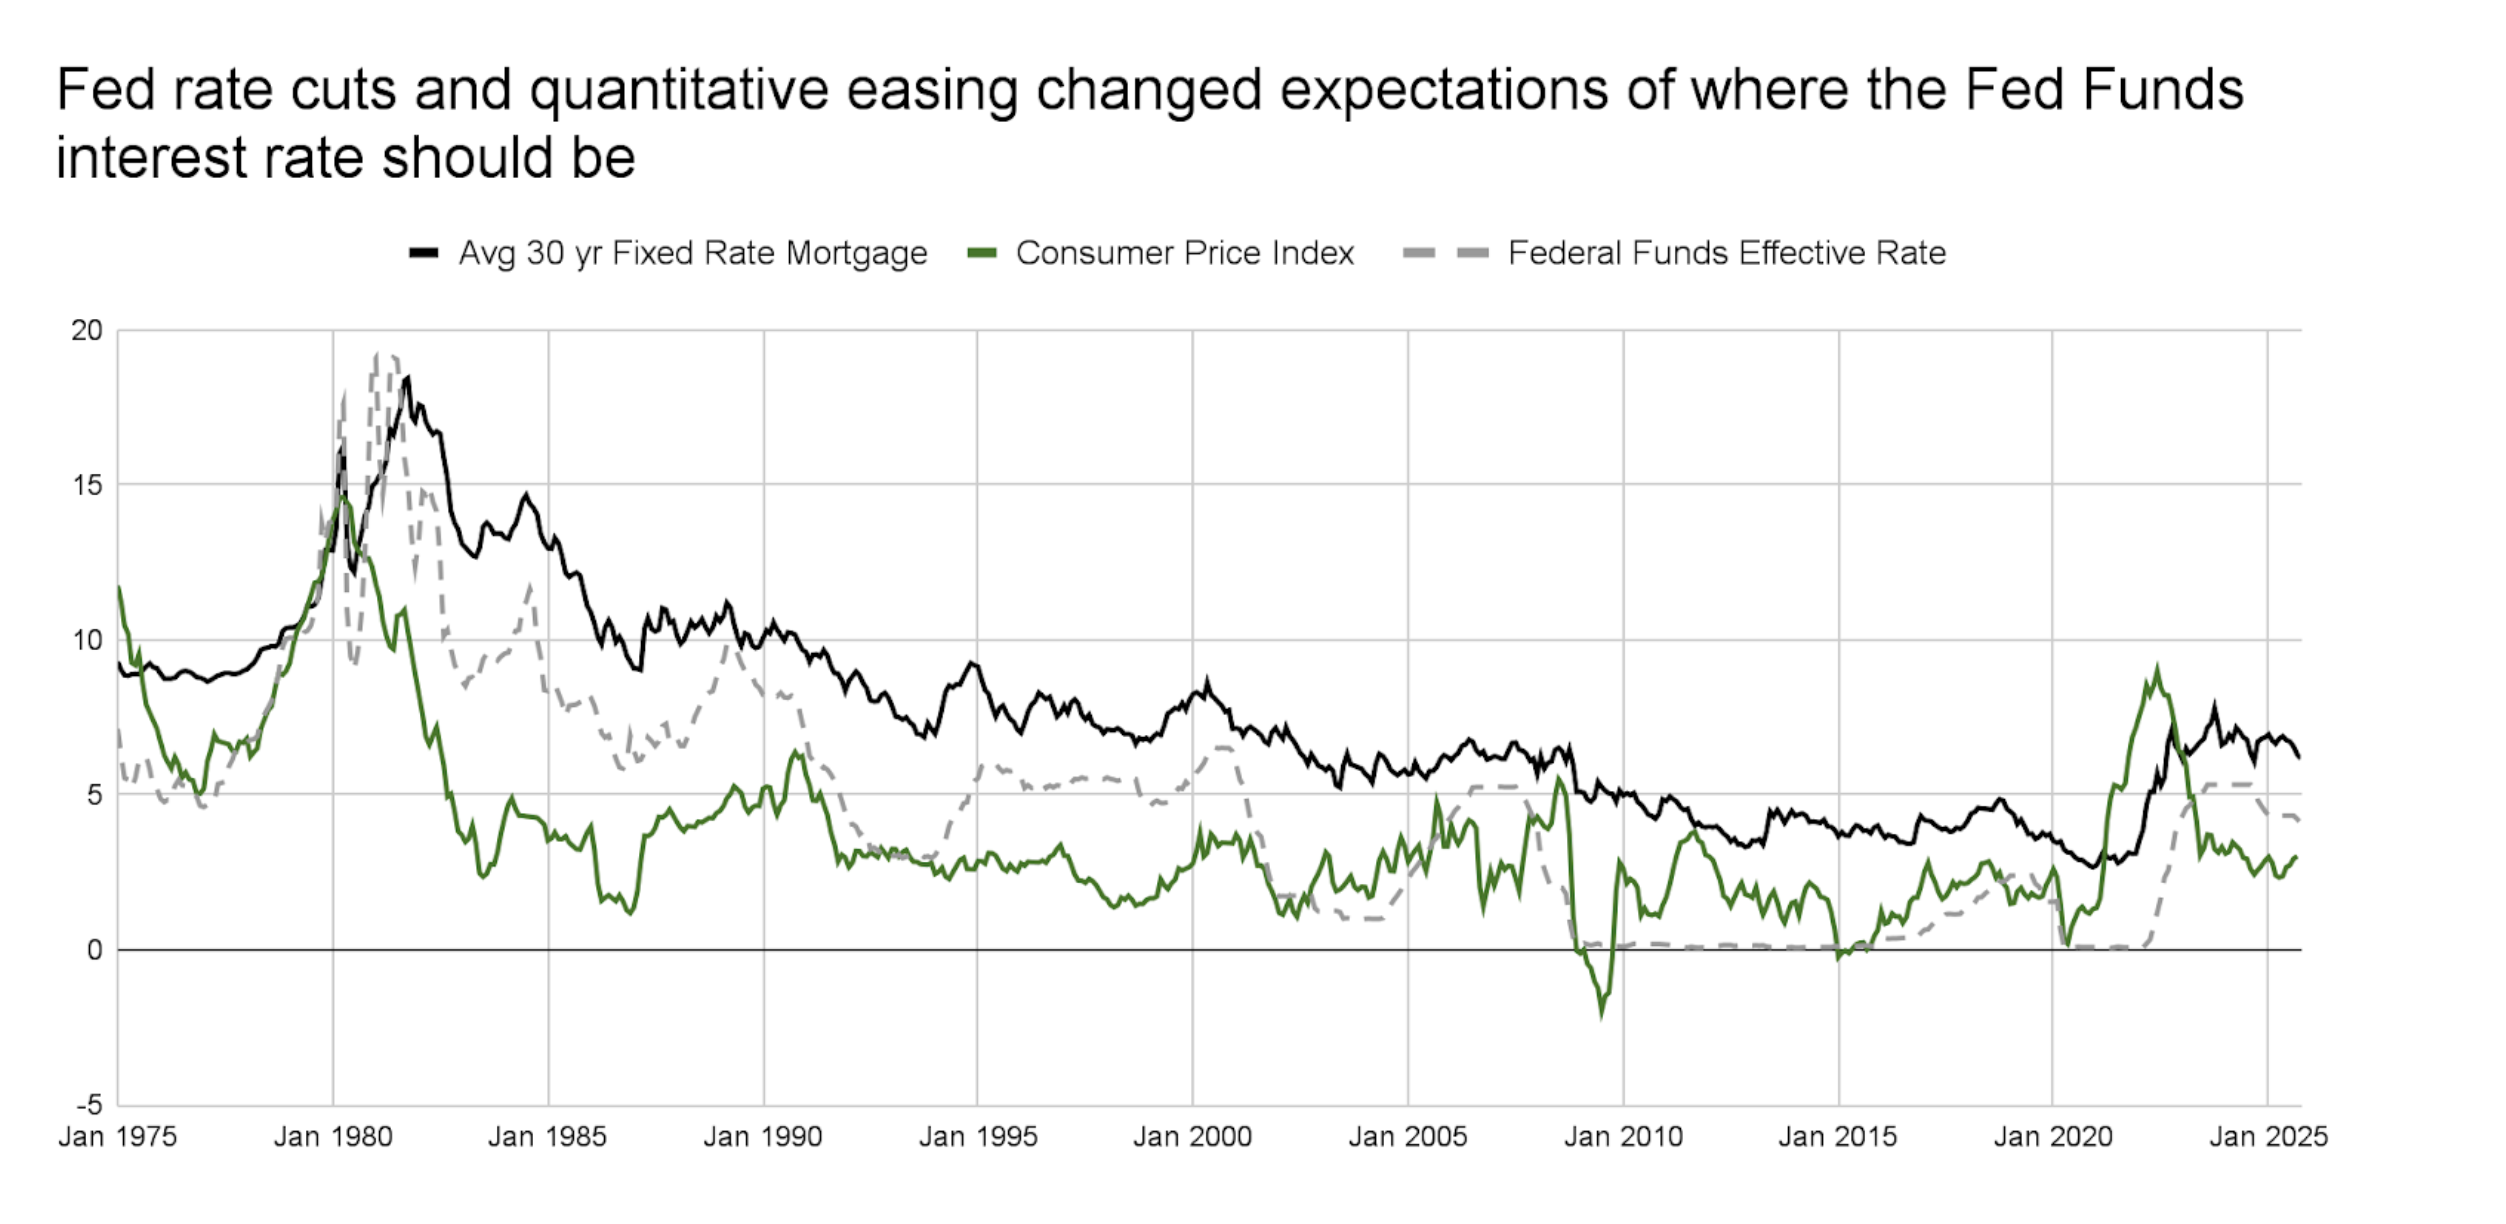
The other thing to note from this chart is how Fed Funds rates (grey line) have fallen relative to mortgage rates (black line) and inflation (green line). They have generally been in between the 2, and about 2% higher than inflation, on average—except during the post-2008 and Covid periods. Now, this relationship is back which tells me unless inflation falls, there isn’t much room for the Fed to cut rates without it being a monetary stimulus (which as we saw can boost asset inflation, exacerbating the problem).
The bottom line: The affordability crisis didn’t appear overnight. It reflects a long arc of decisions that pushed the economy toward asset inflation and away from wage-driven growth.
Juxtaposing all of this against the generally strong equity market, inflation and uncertainty around tariffs puts the Fed into a tough spot between trying to keep asset inflation contained, while also caring about waning affordability with wage growth that hasn’t kept up.
As one of my early mentors (an economist) told me, “the answer to every question is inflation”. Keep price growth down and everything else will likely work out. I think the Fed will need to choose this path vs. “letting the economy run hot.”
And most importantly, in a world where capital captures a growing share of economic gains, asset ownership becomes increasingly central to financial stability.