Government shutdown breakdown
Government shutdown breakdown

How many senators does it take to screw in a lightbulb?
Apparently 60.
Last week, the Senate attempted to advance a Republican-backed bill from the House to continue to fund the government’s operations for a period of time (a continuing resolution). The bill failed in the Senate by a vote of 44 in favor, 48 opposed — far short of the 60 needed to overcome the filibuster. The Senate also rejected a Democratic counterproposal (which included health-care provisions) for lack of support.
So with (another) government shutdown officially here, 60 Senators have not been able to KTLO.
What actually happens during a shutdown?
When funding runs out, government agencies pause operations that aren’t deemed essential. So National parks close, some regulatory filings get delayed, and many federal employees are furloughed (sent home without pay).
This round will likely be a wider government shutdown since Congress hasn’t passed any annual spending bills yet. That means all agencies will experience lapses in funding. Roughly 30% of federal workers — about 600,000 people — are furloughed. Many more employees are required to report to work without pay until funding is restored. Everyone usually eventually gets paid once the government reopens.
Essential programs like Medicare, Social Security, and interest on US debt keep running. But day-to-day ripple effects — like slower approvals, fewer services, and missed paychecks — can drag on households and businesses.
What about the economy?
It depends on the amount of time the government is shutdown. If the time is at all meaningful, the short-term impact tends to be more of a speed bump than a roadblock.
Economists estimate that each week of a shutdown could temporarily reduce quarterly GDP growth by 0.15 percentage points.
If the shutdown overlaps with key survey weeks, the unemployment rate could tick up 0.1–0.2%, even if the real economy doesn’t change much.
Economic data releases would likely be delayed (like the jobs report that’s scheduled for this Friday October 3). If the standoff drags on, November reports could be pushed too.
Federal contractors and service providers may see business disruptions that aren’t always fully made up later.
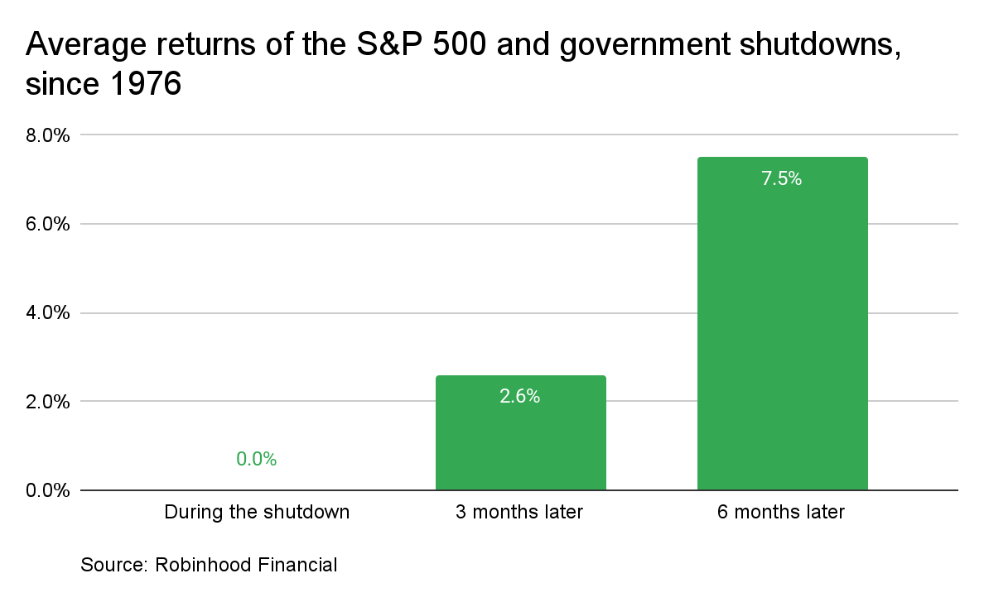
What about the markets?
Well markets tend to shrug off shutdowns because they depend more on the general state of the economy and perceived earnings growth potential. Since 1976, the US government has shut down 20 times prior to this one, with 3 in the last 12 years (since 2013). Over time, the markets have most often been up over the following 6 to 12 months after a shutdown.
As for bonds and the US Dollar: 10-year Treasury yields and the dollar have tended to dip a bit during shutdowns, then steady once the government reopens.
Volatility: Headlines can spook investors, especially if the shutdown drags on. And this time around, it comes at the same time as quarter-end rebalancing that many institutions do at the end of every quarter. This likely means there could be some natural selling pressure for stocks between the two.
But historically, markets move on quickly once it’s resolved.
December 2018-January 2019: The longest ever at 35 days where funding for the border wall was the sticking point, but it only impacted ~25% of spending since most appropriations bills were already passed. CBO estimated ~$11bn in lost output, though much was later recovered.
The 2nd longest was in 1995 under Clinton at 22 days. While there was an initial, short-lived dip, the S&P 500 actually ended the shutdown period with a slight gain of 0.3%. Economic growth was buoyant during this time, which overshadowed the disruption.
The worst performing markets during shutdowns was in the 70s, when the economy had a lot of other issues (like big inflation).
Shutdowns are disruptive, but history suggests they’re more noise than lasting damage.
Right now, we see the biggest inconvenience being delayed data, unpaid (for now) federal workers, and a lot of political theater. Expect a little noise, but remember that markets have seen this movie before.
If it does drag on for a while, our relaxed tune might change.