Corgi UNH 2x Daily ETF

Why Robinhood?
Robinhood gives you the tools you need to put your money in motion. You can buy or sell UN and other ETFs, options, and stocks.About UN
UN provides 2x leveraged exposure, less fees and expenses, to the daily price movement for shares of UnitedHealth Group Incorporated (NYSE: UNH), through derivatives such as swaps.
UN Key Statistics
Stock Snapshot
Corgi UNH 2x Daily ETF(UN) stock is priced at $22.74, giving the company a market capitalization of 341.17K.
Corgi UNH 2x Daily ETF(UN) stock opened on 2026-10-29 at —. The price climbed to — and dipped to —.
The Corgi UNH 2x Daily ETF(UN)'s current trading volume is 0, compared to an average daily volume of 814.28.
In the last year, Corgi UNH 2x Daily ETF(UN) shares hit a 52-week high of $27.11 and a 52-week low of $18.64.
In the last year, Corgi UNH 2x Daily ETF(UN) shares hit a 52-week high of $27.11 and a 52-week low of $18.64.
UN News
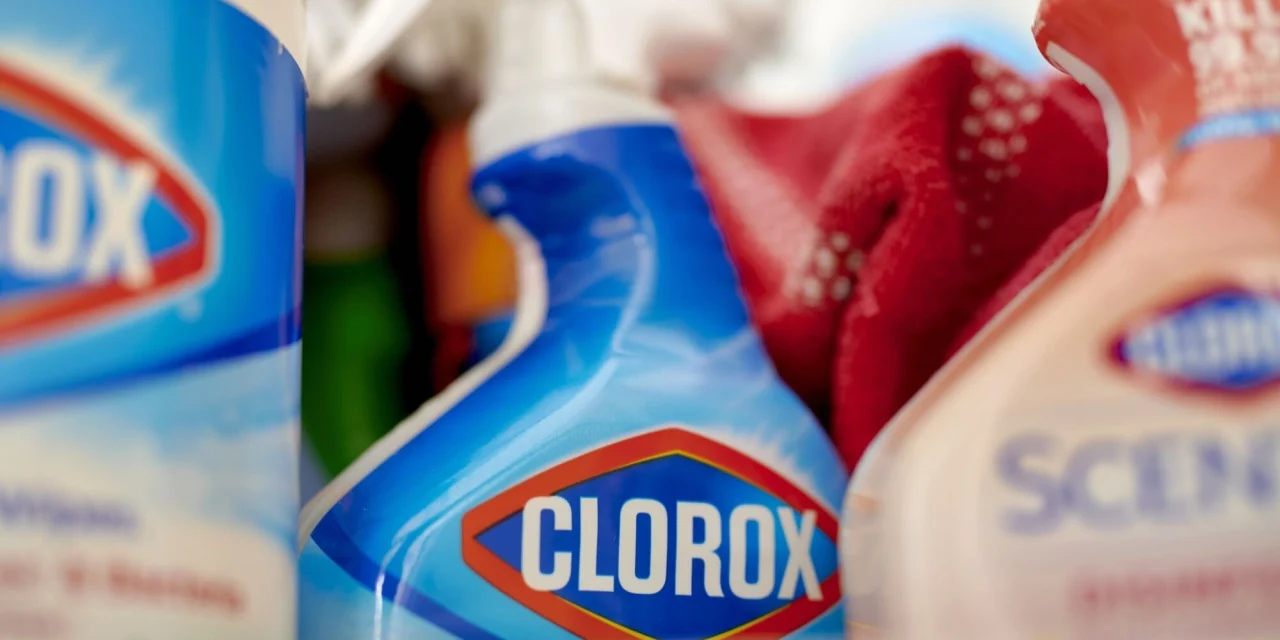
Fabian Garcia will step into the role effective Jan. 5, succeeding Linda Rendle who announced in May that she was stepping down for health reasons. Gabby Jones...
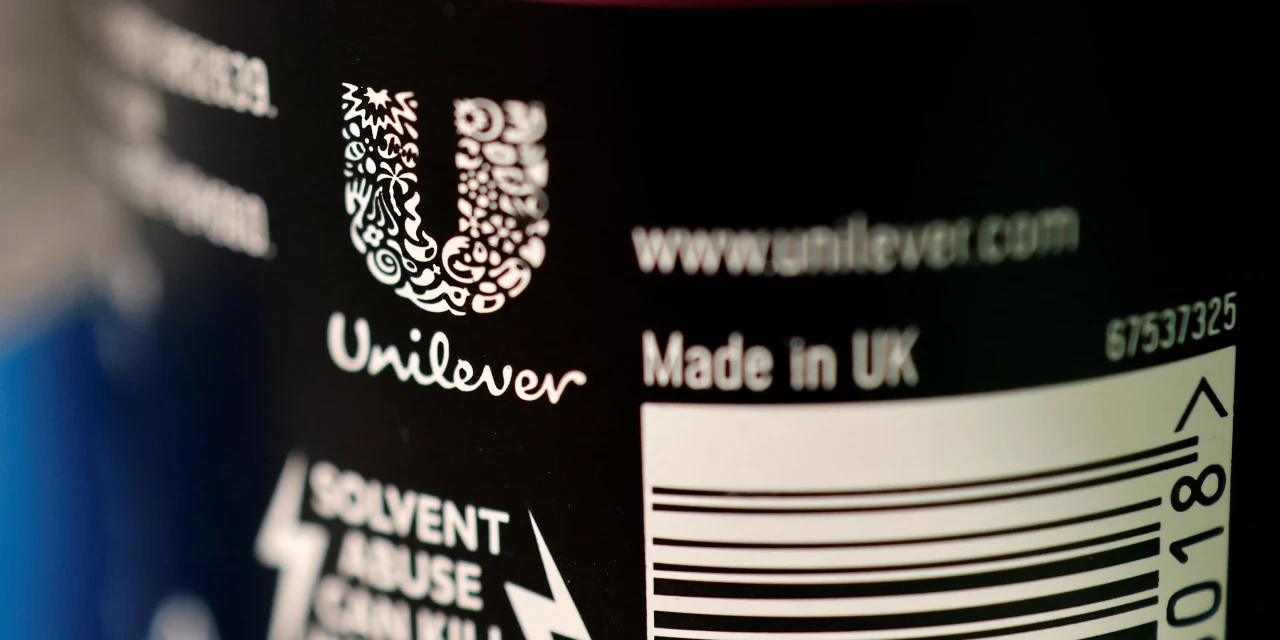
Unilever said volume growth in the third quarter was at 2.9%. Tolga Akmen / Agence France-Presse / Getty Images Unilever ULVR -0.62 %decrease; down pointing tr...
Average Annual Return
Similar Marketcap
This list is generated by looking at the six larger and six smaller companies by market cap in relation to this company.
Popular Stocks
This list is generated by looking at the top 100 stocks and ETFs most commonly held by Robinhood customers and showing a random subset
Newly Listed
This list is generated by showing companies that recently went public.