Valmont
1D
1W
1M
3M
YTD
1Y
5Y
ALL

Why Robinhood?
Robinhood gives you the tools you need to put your money in motion. You can buy or sell Valmont and other ETFs, options, and stocks.About VMI
Valmont Industries, Inc. engages in the manufacture of products and services for infrastructure and agriculture markets. It operates through the Infrastructure and Agriculture segments.
CEOAvner M. Applbaum
CEOAvner M. Applbaum
Employees11,125
Employees11,125
HeadquartersOmaha, Nebraska
HeadquartersOmaha, Nebraska
Founded1946
Founded1946
Employees11,125
Employees11,125
VMI Key Statistics
Market cap4.84B
Market cap4.84B
Price-Earnings ratio29.13
Price-Earnings ratio29.13
Dividend yield1.16%
Dividend yield1.16%
Average volume172.24K
Average volume172.24K
High today$240.11
High today$240.11
Low today$212.62
Low today$212.62
Open price$225.04
Open price$225.04
Volume119.63K
Volume119.63K
52 Week high$303.57
52 Week high$303.57
52 Week low$188.63
52 Week low$188.63
VMI News
Yahoo Finance 3h
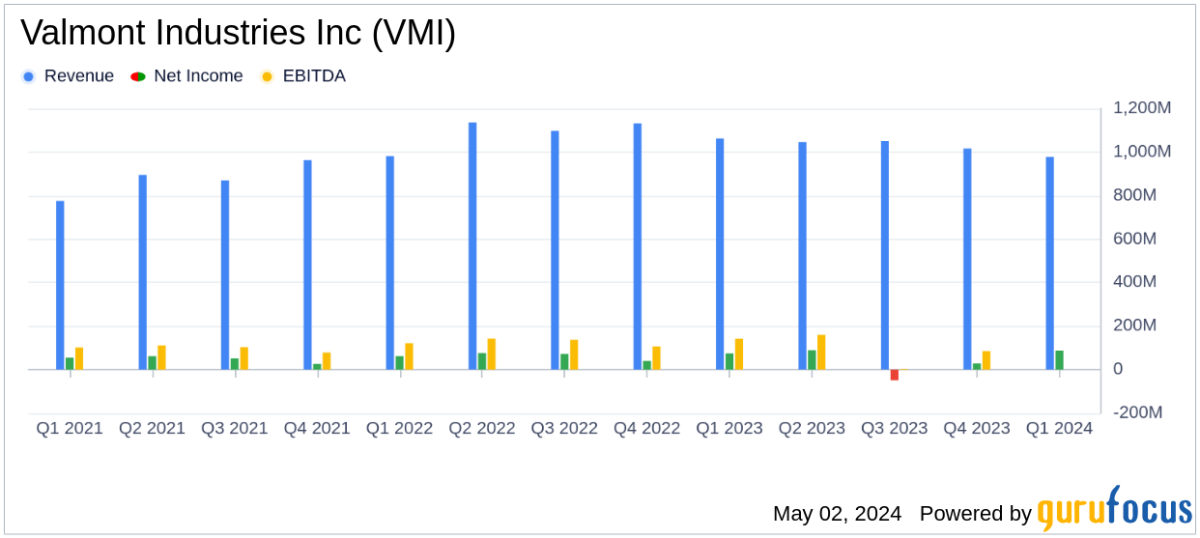
Valmont Industries Inc Q1 Earnings: Surpasses EPS Estimates, Raises 2024 Guidance - Yahoo FinanceRevenue: Reported at $977.83 million, down 8.0% year-over-year, falling short of estimates of $986.98 million. Net Income: Reached $87.82 million, up 17.8% fro...
Simply Wall St 1d
Are Valmont Industries, Inc.'s Fundamentals Good Enough to Warrant Buying Given The Stock's Recent Weakness? - Simply Wall StIt is hard to get excited after looking at Valmont Industries' (NYSE:VMI) recent performance, when its stock has declined 10% over the past month. But if you pa...

Analyst ratings
67%
of 6 ratingsBuy
66.7%
Hold
33.3%
Sell
0%