The value of stores of value: gold, rates and the US dollar
The value of stores of value: gold, rates and the US dollar
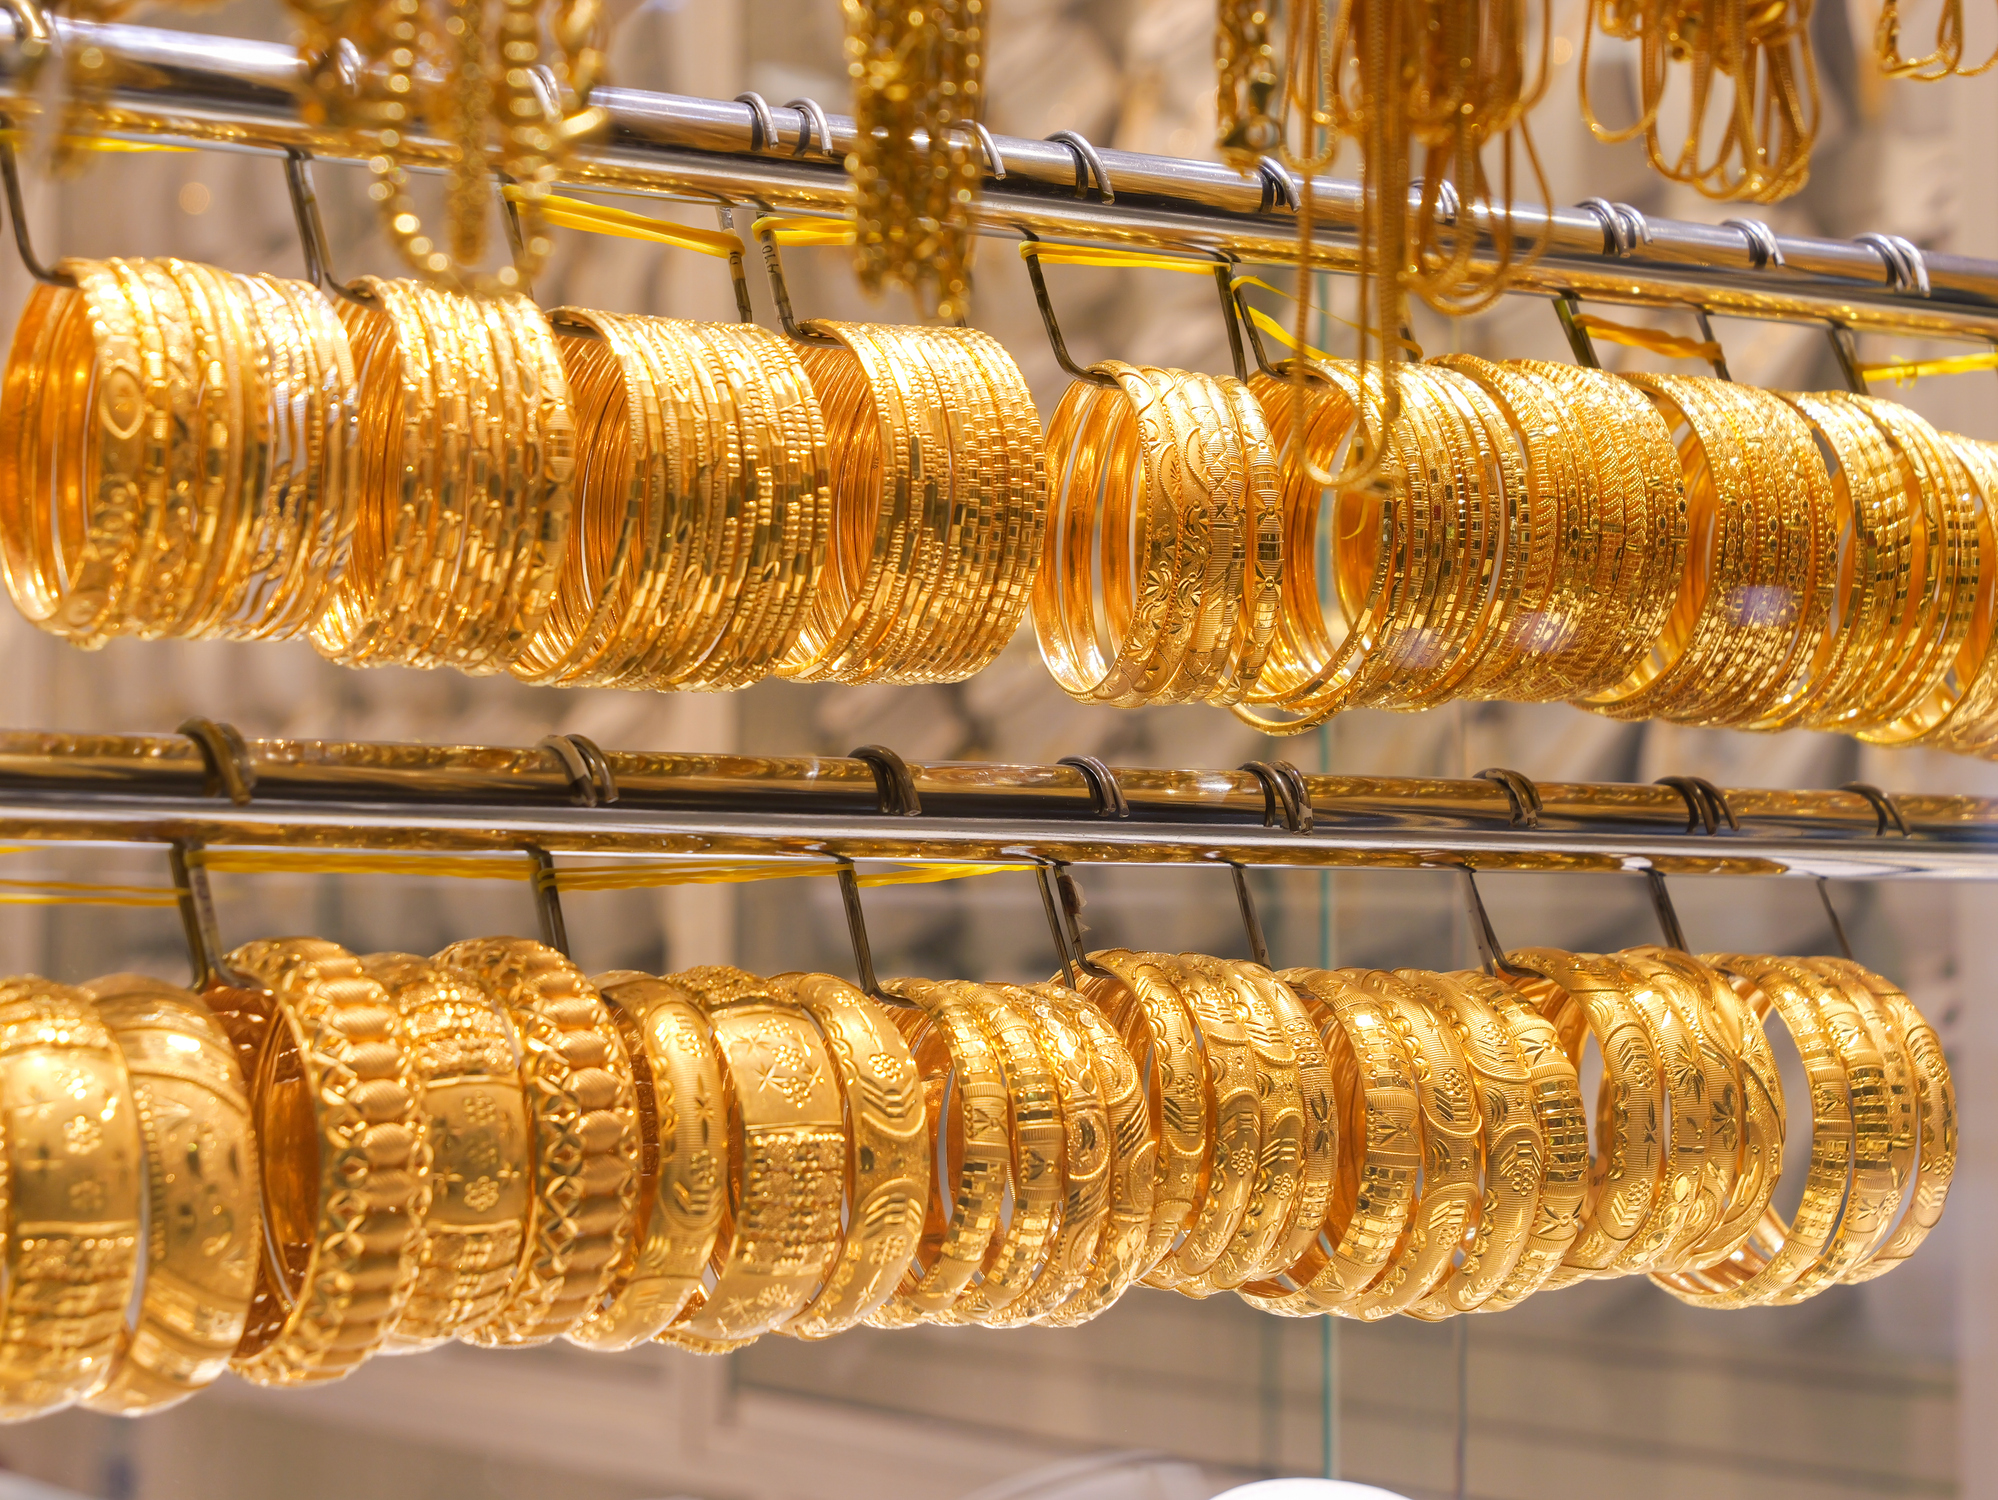

My grandparents tucked away a little gold and silver as often as they could. Coins kept in a box at the bottom of a drawer, a necklace gifted for a holiday, a bracelet given for a birthday. Underneath the shiny present was insurance against a day when or if paper could stop being trusted. It’s something they lived through in Eastern Europe in the lead up to World War II they could never forget. And it taught me the potential for enduring value in physical assets.
This year, gold has again not stayed quietly in a drawer. It's now trading around $4,400 an ounce, up roughly 31% year-to-date, and after a respite, up about 10% in the last month.

The easy explanation for gold’s move is "safe haven buying" thanks to Hormuz, Iran, and Fed uncertainty. While that’s likely not wrong, it's incomplete. A few different desks I follow have converged on something more: the slow repricing of what a reserve currency is.
For background, a reserve currency does three things:
It's a medium of exchange
A store of value
A unit of account.
The dollar has held all three roles since 1971, when it stopped being backed by gold. Historically, when a currency starts losing its grip, the store-of-value function is the first thing to go, in favor of a rising gold value, while the other two can stick around for decades out of habit.
Since 2022, central banks have bought gold at roughly double the 2010-2021 average pace: over 1,000 tonnes a year at the peak, and still running at close to 850-860 tonnes now. Buyers include Poland, the Persian Gulf countries, and emerging-market and non-aligned central banks. They may have gotten nervous after watching the US freeze Russia's dollar reserves—after all, if your government's savings can be frozen by someone else's foreign policy, a physical metal that can’t be sanctioned can start looking more attractive.
Most recently, central banks bought 289 tonnes in the second quarter alone—a 62% jump from a year earlier and the strongest Q2 on record—and they did it while gold had its steepest quarterly price decline in a decade. Poland led again (pushing its stockpile to 632 tonnes against a 700-tonne target), and China added 33 tonnes, its largest quarterly purchase since late 2023. In the World Gold Council's own survey, 89% of central bankers expect global reserves to keep rising over the next year.
The Gulf states also no longer recycle all their oil money into US treasuries at the same pace they have over the last 50 years. Over the past year, they've invested close to $66 billion into AI infrastructure, even while running current account deficits.
Put that together with the hundreds of billions US corporates are also spending on AI infrastructure—increasingly funded with borrowed money—and it starts to look like an attempt to build a 'compute-dollar' to replace a fraying petrodollar.
This isn't a new observation. In my 2026 outlook, I flagged that central bank gold buying had been running hot since 2022, though it cooled a bit off from its 2024 pace. ETF-based investment demand had taken over the gold story in 2025, as gold ETFs accounted for more than 60% of total US investment demand in the metal. My call at the time was that ETF demand would settle into something steadier in 2026, while central bank buying would pick back up again—particularly out of China and India, whose official reserves still looked light relative to their economies. That's roughly held up. ETF flows went negative for the year before turning positive again this past month, while central banks kept buying the whole way through. That combination was the basis for my $4,700/oz target this year (with more volatility). The Fed and the Treasury are also doing some of the work.
The first factor is a new Fed chair with a new framework. Chair Warsh has been explicit that AI is "the most disruptive moment in modern economic history," and that hawkish/dovish labels are too small for an economy where productivity might be rising well before the labor market shows it. To me, this means more tolerance for growth and inflation, while the Fed waits to see how AI nets out. If the labor market keeps softening (we had the weakest six-month payroll trend since 2012, excluding the COVID period) while earnings keep growing on AI productivity, that's a setup where real yields can compress even with a rate hike.


That's the short end. In longer term rates, as you can see from the chart just above, the 10 year has been rising without an equal rise in inflation, meaning real long term rates have been going up. This is because the financial plumbing has flashed warnings.
In the last week of July, the US and Japan jointly intervened to support the yen, the first time since 1998. Days later, the US Treasury floated a facility that let Japan raise dollars against its Treasury holdings, instead of selling them outright. This means the Treasury made sure Japan didn’t sell their Treasury bonds (which would have increased interest rates for the US), and instead received a loan from the Treasury to use for their currency needs. This is something you do when a heavily indebted borrower and a heavily indebted lender both need the relationship to keep working smoothly. Gold rallied more than 7% that same week—one of its best since 2008. Then, yesterday, the US Treasury announced it will increase the size of its treasury buyback operations for long-end bonds from $2B to at least $4B per operation. This is significantly different than the Fed’s past QE because it doesn’t reduce bond supply and it’s not yield curve control. The Treasury is targeting pockets of illiquidity in an attempt to boost bond prices, which helps them. It is effectively conducting a Treasury-led “Operation Twist”, like the Fed did in 2011, reducing duration from the market to put downward pressure on long-term borrowing costs. The sizing is small compared to the amount of Treasury issuance, so the action is largely symbolic. But it still had an effect as a signal. Bitcoin also popped on this news as an alternative to currency, often considered the next gen gold.
Combining the two: Rates are the new market put. They get high enough and action is taken to stamp them down. Naturally, the US Treasury likely does not want, and can’t afford, higher long-term rates. More importantly, it needs to prevent potential destabilization that comes with broader selling of US government bonds, especially at the long end, given how much they have outstanding. The US national debt recently reached $40Tr.
This story is not new (see my 2023 piece). But it certainly feels like it is mattering more now.
A few things worth watching in either direction for gold:
What would confirm it: central bank gold buying holding near Q2's pace, especially out of China and India, whose reserves still look light relative to their economies. And since ETF flows have been positive again for the last month, if that demand continues to rise.
What would kill it: a clean AI productivity story that shows up in the data without labor-market damage, a Fed that reverts to a standard 2%-target playbook, or Gulf security concerns fading enough that the old petrodollar arrangement looks stable again.
A small diversifying slice of a portfolio in gold may be the right move. My family's stash of gold never had a thesis attached to it. Just a sense that some things shouldn't depend on anyone else's promise. This year, that pitch is landing with more than just the relative who keeps it in a drawer.