Carpenter Technology

Trade Carpenter Technology 24 hours a day, five days a week on Robinhood.
Robinhood gives you the tools to revolutionize your trading experience. Use the streamlined mobile app, or access advanced charts and execute precise trades on our browser-based platform, Robinhood Legend. Risks and limitations apply.About CRS
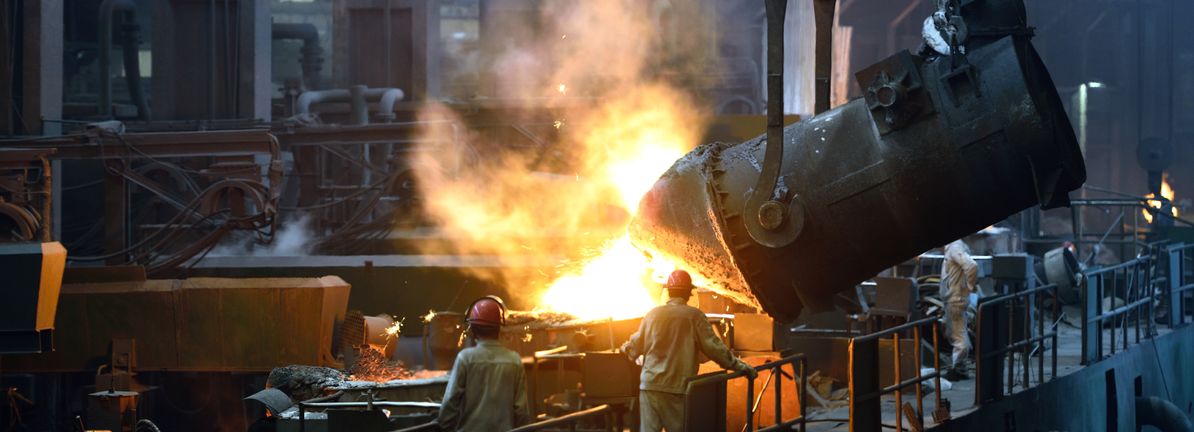
Carpenter Technology Corp. engages in the manufacturing, fabrication, and distribution of specialty metals. It operates through the Specialty Alloys Operations and Performance Engineered Products segments.
CRS Key Statistics
Stock Snapshot
With a market cap of 27.52B, Carpenter Technology(CRS) trades at $532.43. The stock has a price-to-earnings ratio of 58.35 and currently yields dividends of 0.14%.
On 2026-07-29, Carpenter Technology(CRS) stock traded between a low of $521.13 and a high of $557.52. Shares are currently priced at $532.43, which is +2.2% above the low and -4.5% below the high.
Carpenter Technology(CRS) shares are trading with a volume of 307.52K, against a daily average of 669.66K.
In the last year, Carpenter Technology(CRS) shares hit a 52-week high of $625.99 and a 52-week low of $228.00.
In the last year, Carpenter Technology(CRS) shares hit a 52-week high of $625.99 and a 52-week low of $228.00.
CRS News
Global markets are still trying to make sense of sticky inflation, shifting rate expectations and mixed economic data from the US, Europe and Asia. In that kind...

Unlock powerful investing tools with TipRanks Premium to make smarter, more confident investment decisions Subscribe to TipRanks Smart Investor Newsletter, and...
...

Analyst ratings
73%
of 11 ratingsMore CRS News
Carpenter Technology (CRS) announced that Brian Malloy, the company’s president and CEO, passed away suddenly and unexpectedly on Friday, July 24. Tony Thene, t...
Agnico Eagle Mines Limited AEM announced that it has made an investment in Cadillac Mines Corporation through a private placement that will accompany Cadillac's...

Carpenter Technology (CRS) is in focus ahead of its July 30 earnings report, with expectations for year over year growth in earnings and revenue shaping how inv...
In recent trading, shares of Carpenter Technology Corp. (Symbol: CRS) have crossed above the average analyst 12-month target price of $123.60, changing hands fo...
Carpenter Technology stock has delivered an extremely strong run over the past few years, yet its valuation checks now lean expensive. This raises questions abo...
People also own
Similar Marketcap
This list is generated by looking at the six larger and six smaller companies by market cap in relation to this company.
Popular Stocks
This list is generated by looking at the top 100 stocks and ETFs most commonly held by Robinhood customers and showing a random subset
Newly Listed
This list is generated by showing companies that recently went public.