Corning

Trade Corning 24 hours a day, five days a week on Robinhood.
Robinhood gives you the tools to revolutionize your trading experience. Use the streamlined mobile app, or access advanced charts and execute precise trades on our browser-based platform, Robinhood Legend. Risks and limitations apply.About GLW
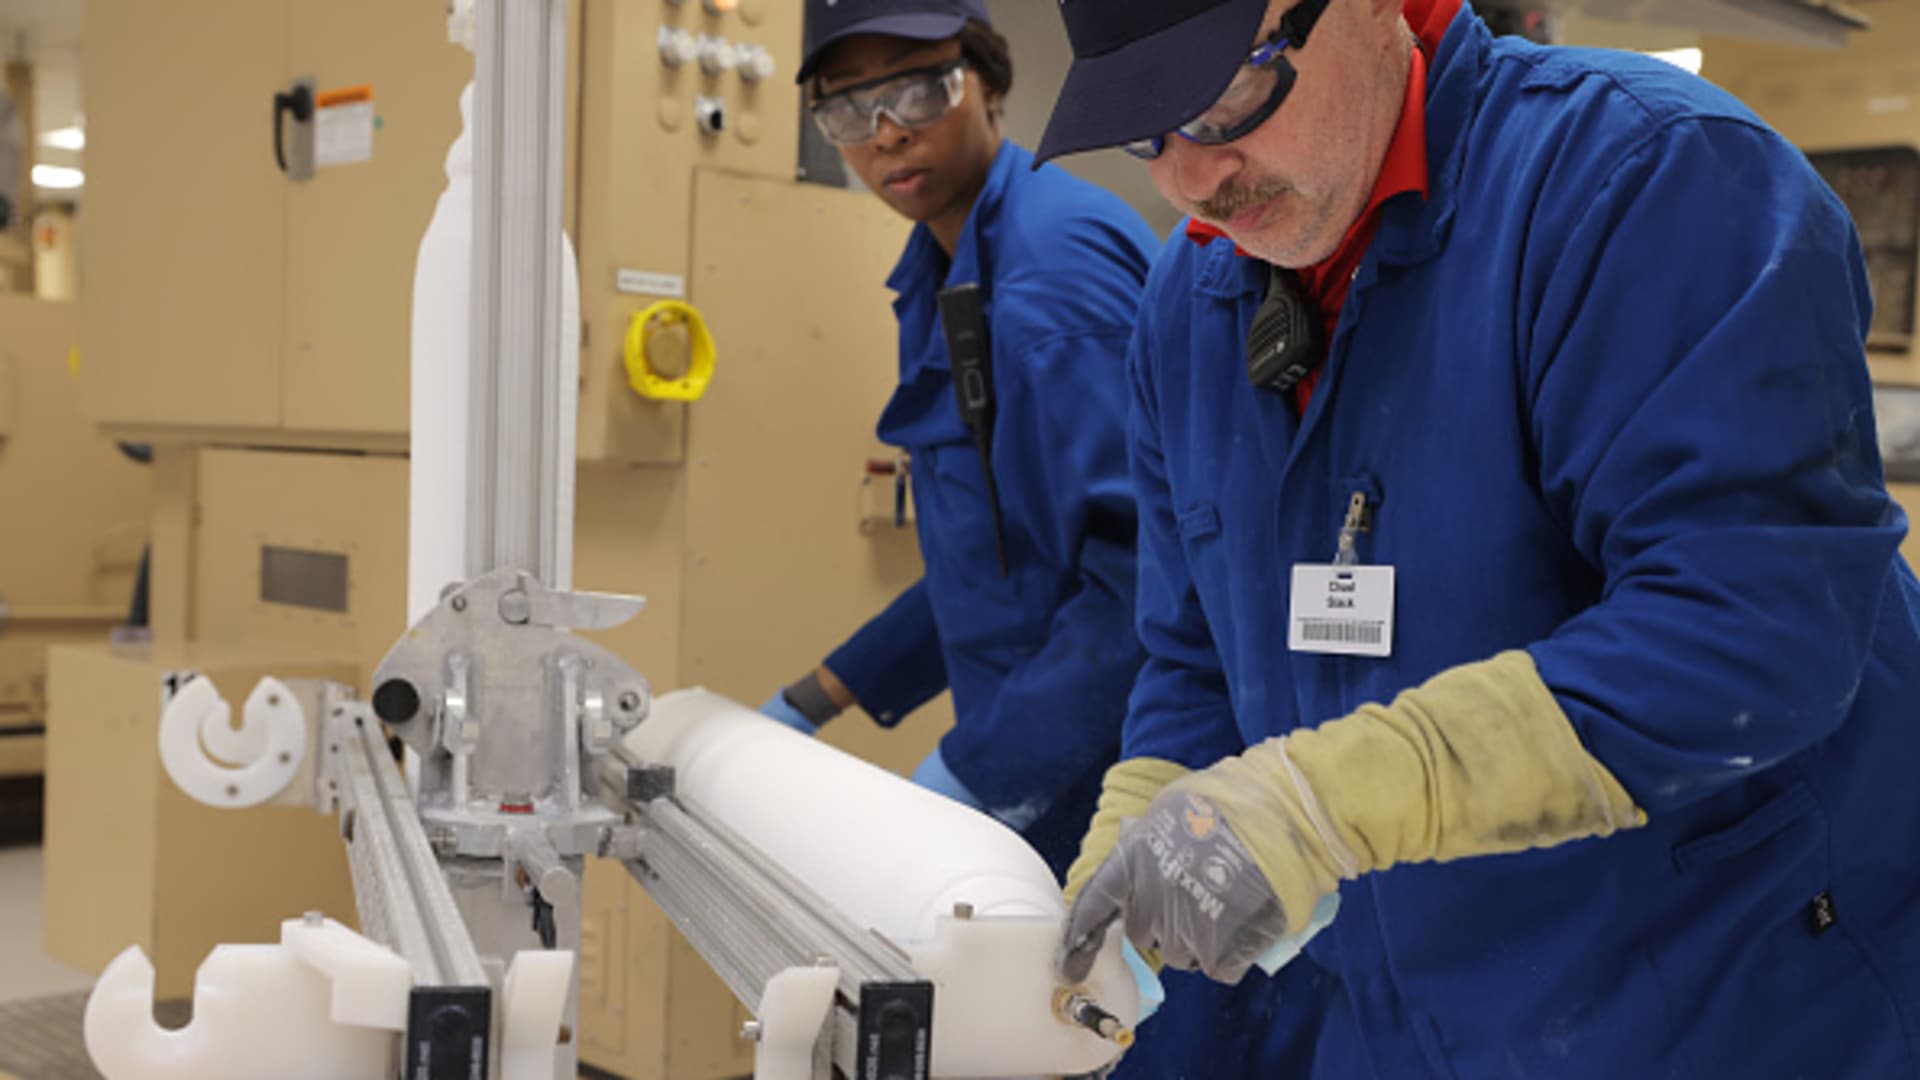
Corning, Inc. engages in the provision of glass for notebook computers, flat panel desktop monitors, display televisions, and other information display applications, carrier network and enterprise network products for the telecommunications industry, ceramic substrates for gasoline and diesel engines in automotive and heavy-duty vehicle markets, laboratory products for the scientific community and polymer products for biotechnology applications, optical materials for the semiconductor industry and the scientific community, and polycrystalline silicon products and other technologies. It operates through the following segments: Optical Communications, Display, Specialty Materials, Automotive, and Life Sciences.
GLW Key Statistics
Stock Snapshot
With a market cap of 120.41B, Corning(GLW) trades at $139.91. The stock has a price-to-earnings ratio of 56.90 and currently yields dividends of 0.90%.
On 2026-07-31, Corning(GLW) stock traded between a low of $138.50 and a high of $146.64. Shares are currently priced at $139.91, which is +1.0% above the low and -4.6% below the high.
Corning(GLW) shares are trading with a volume of 5.75M, against a daily average of 16.5M.
During the past year, Corning(GLW) stock moved between $61.44 at its lowest and $271.78 at its peak.
During the past year, Corning(GLW) stock moved between $61.44 at its lowest and $271.78 at its peak.
GLW News
Wednesday’s tech selloff has caused serious technical damage. The Nasdaq Composite fell 1.74% to reach a three-month low, as the tech-heavy index broke down fr...
Key Points Corning has manufactured glass for some of the world's most revolutionary products for the last 175 years. The company has become a top supplier of...

Corning (NYSE: GLW) delivered a Q2 2026 earnings beat on Tuesday. But if shareholders thought it would break the stock’s slide, they were mistaken. Shares tumbl...
Analyst ratings
75%
of 20 ratingsMore GLW News
With inflation signals mixed across major economies and policy expectations shifting, many investors are looking more closely at cash flow rather than short ter...

With inflation signals mixed and central banks keeping rates tight, many investors are searching for stocks where cash generation looks solid but prices still s...
Corning Inc. (NYSE:GLW) on Tuesday reported better-than-expected second-quarter 2026 results. Adjusted earnings rose 30% year over year to 78 cents per share,...

The stock has already reflected some of that optimism. Shares have surged more than 103% over the past year and are up nearly 39% year to date, as investors inc...
BofA is renewing Argenx (ARGX) for a new term following 52 weeks on the firm’s “US 1 List” while removing Corning (GLW). The US 1 List is a collection of the be...
Corning Inc ((GLW)) has held its Q2 earnings call. Read on for the main highlights of the call. Claim 55% Off TipRanks Unlock powerful investing tools with TipR...
Corning shares are getting crushed on Tuesday after the specialty glassmaker delivered strong quarterly results. We attribute the weakness to the broader market...
People also own
Similar Marketcap
This list is generated by looking at the six larger and six smaller companies by market cap in relation to this company.
Popular Stocks
This list is generated by looking at the top 100 stocks and ETFs most commonly held by Robinhood customers and showing a random subset
Newly Listed
This list is generated by showing companies that recently went public.