Using charts
Charts help to show how much the price of an asset has moved up or down within a certain time period.
Overall portfolio return
On your Robinhood Crypto account Portfolio page, your chart shows today’s overall portfolio return in Euros and percent.
The daily return for crypto is calculated using today’s prices as of 12 AM (midnight in your time zone).
Chart options
On Robinhood Crypto, you can view a standard or advanced chart for a crypto. There are 2 types of charts you can look at:
- The line chart shows you the closing price at any point in time.
- The candlestick chart shows you 5 data points (open, close, low, high, and price direction) during a time interval.
In the app, you can view a standard or an advanced version of either the line or candlestick chart.
Advanced charts
The following shows the difference between the standard and advanced line charts for Bitcoin within the app:


Time intervals
Indicators are calculated over a period of time, which are defined by the number of intervals. The length of an interval depends on the time span shown in the chart. You can select different time spans ranging 1 hour to 5 years. Each time span plots a different time interval.
Interval lengths depend on the selected time span, the chart view, and what you’re viewing. On advanced charts in the app, you can customize the interval used in the chart.
- 1H (1-hour) chart, 1 interval is 15 seconds
- 1D (1-day) chart, 1 interval is 30 minutes
- 1W (1-week), 1 interval is 4 hour
- 1M (1-month) chart, 1 interval is 1 hour
- 3M (3-month) chart, 1 interval is 1 day
- 1Y (1-year) chart, 1 interval is 1 week
- 5Y (5-years) chart, 1 interval is 1 month
About line charts
The line chart view is shown by default.
You’ll see the price line in either the standard or advanced chart view. It shows how volatile the price was for the selected time period. Large swings up or down indicate a very volatile price. Short or steady changes imply a relatively stable price that’s moving in one direction during the selected time period.
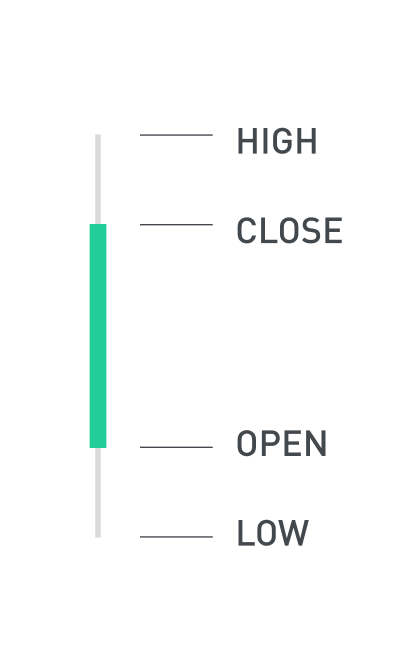
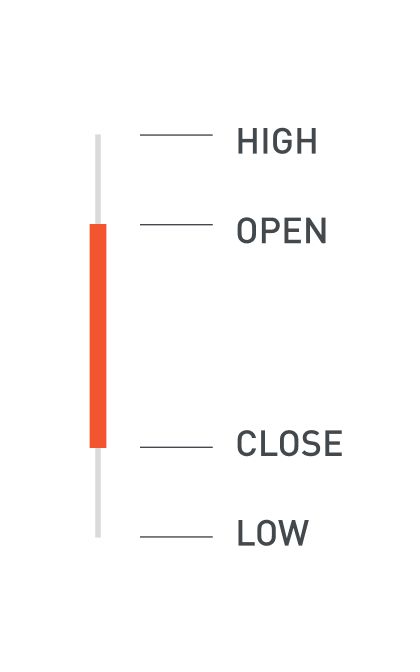
About candlestick charts
Each candlestick includes the following during the selected time interval of each candle:
- Open is the beginning price
- Close is the price of the last trade
- High is the highest price reached
- Low is the lowest price reached
The following shows a candlestick chart, where the body, or thick part, of the candlestick represents the difference in the open and close prices. If it has no body, it means the open and close prices are the same.
The wicks, or thin lines, of the candlestick represent the high and low prices in the selected time interval.
A bullish candlestick is green when the price has increased, meaning the close price is above the open price:
A bearish candlestick is red when the price has decreased, meaning the close price is below the open price:


Disclosures
Crypto markets are highly volatile, and trading or holding crypto can lead to loss of your assets. Crypto is not legal tender, and is not backed by any government or covered by any government compensation scheme.
Robinhood Europe, UAB ("RHEU" or "Robinhood") (company code: 306377915) is authorized and regulated by the Bank of Lithuania ("BoL") as a financial brokerage firm, a crypto-asset service provider, and a payment institution. RHEU’s registered address is: Vilniaus g. 33-201, LT-01402 Vilnius, Lithuania; website.