Profit and loss charts
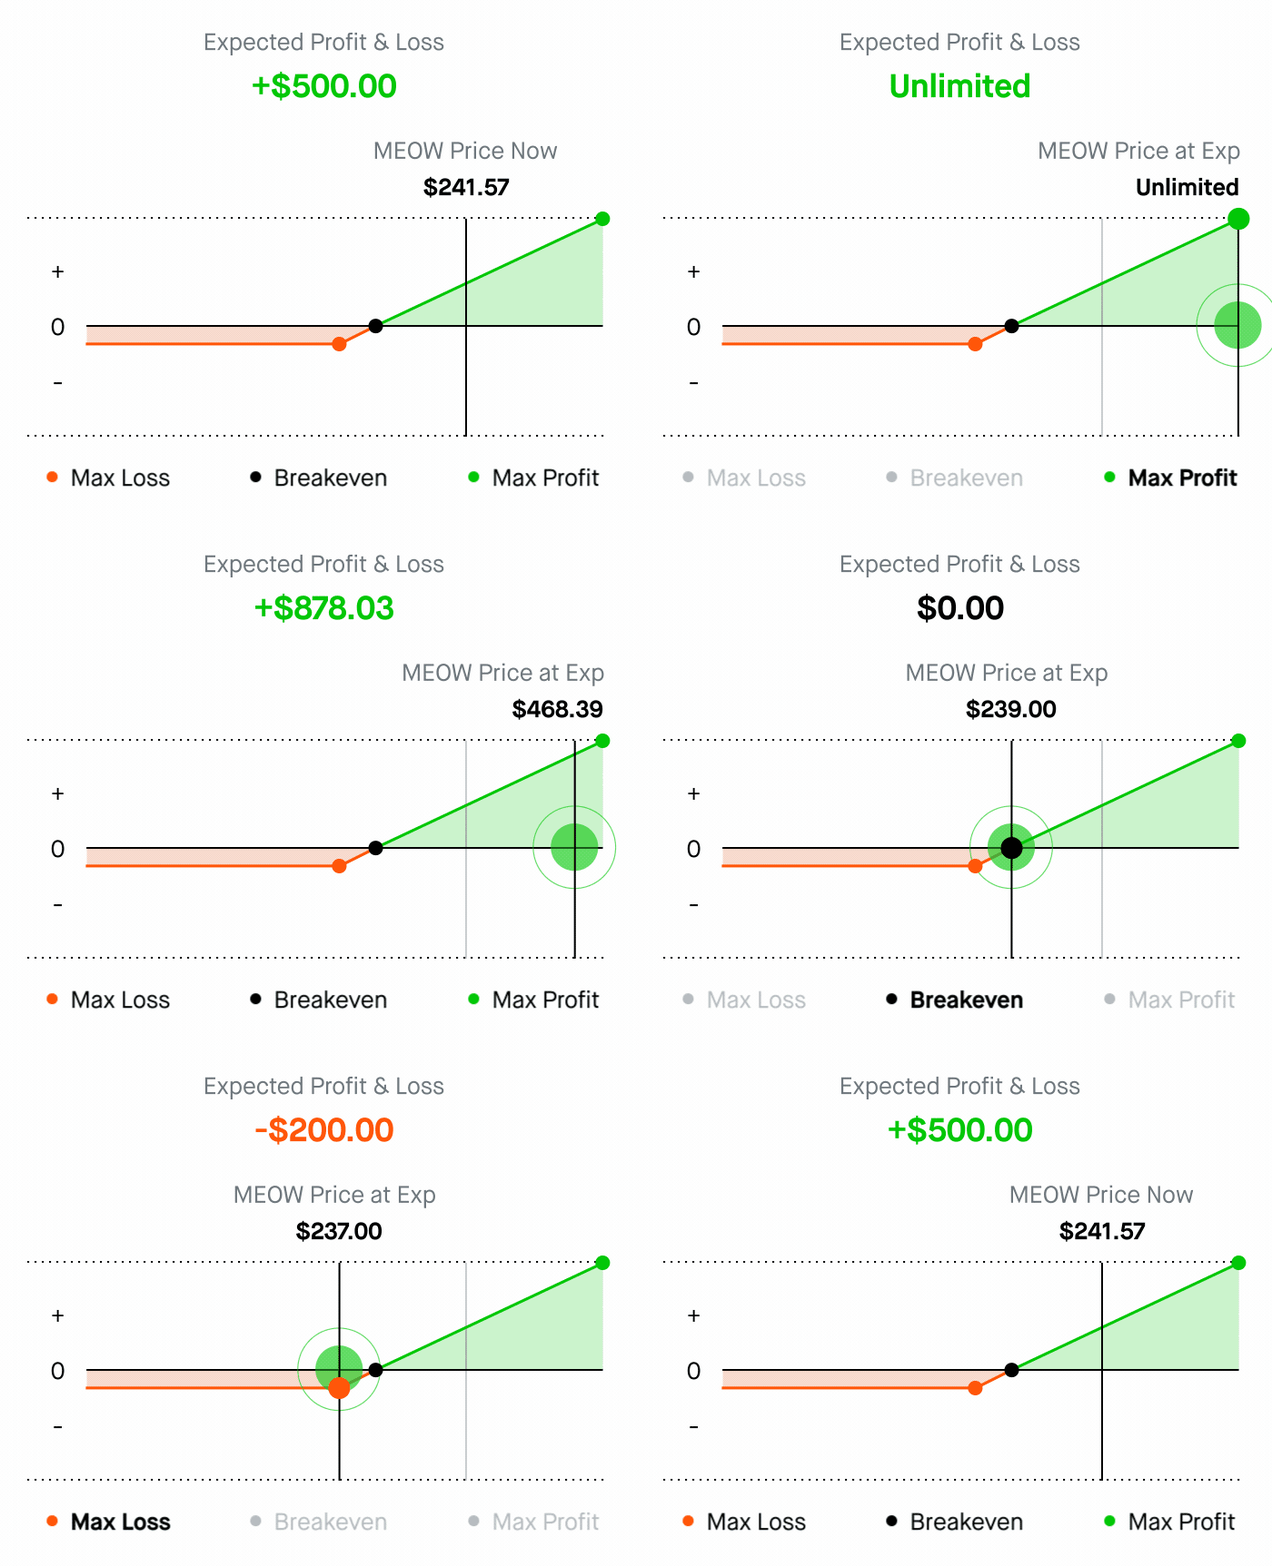
You can use the profit and loss (P/L) chart to visualize an option strategy’s theoretical profits or losses at expiration. This is a great way to gain some insight into a particular options strategy before you enter into a position.
How does it work?

The vertical (Y-axis) represents the theoretical profit (+) and loss (-) range. Anything above zero represents theoretical profit while the area below represents theoretical loss. Both values assume the option is held until expiration.
The horizontal (X-axis) represents the stock price at expiration. When it comes to a calendar spread, which contains both long and short options at identical strike prices across two different expiration dates, the expiration of the front month option is the assumed expiration date.
How can it help me make informed decisions for my options trading?
The P/L chart can help you gauge the theoretical risk and reward of any given options strategy. This is one of the most important keys to choosing a strategy because you’ll get an idea of how much money you can potentially make or lose. This assumes all options are held until expiration and not closed, exercised, or assigned before then.
Keeping track of your breakeven is another important factor. Assuming you hold the position to expiration, this is the price the underlying stock must be above or below in order to potentially make money at expiration. Helpfully, this includes any premium paid or collected when the position was established.
For example, let’s revisit the previous YOWL 237 call, which has a premium of $2. The theoretical max profit would be unlimited because there’s no upper limit on how much the stock can potentially gain. You also know that you need the price to hit $239 to break even at expiration. The breakeven price for a long call is the strike price (237) plus the premium paid ($2). The theoretical max you can lose (max loss) is going to be $200, which is the premium paid ($2 x the contract multiplier of 100).
Keep in mind, this graph is only showing potential profit and loss at expiration. Actual gains may vary prior to expiration. For more helpful options education, check out Options trading essentials.
What are the different P/L charts?
The P/L chart is interactive and as you select different contract strategies, it’ll adjust accordingly. At Robinhood we categorize them into Level 2 and Level 3 strategies. For details about the more common strategies and their P/L examples, check out the Calculations section for each strategy in Basic options strategies (Level 2) and Advanced options strategies (Level 3).
Disclosures
The P/L chart assumes positions will be held until expiration. Actual losses may exceed calculated values due to changes in implied volatility, early assignment and ex-dividend dates.
The P/L chart shows hypothetical calculations based on model assumptions and other inputs, which may not reflect actual market conditions and don’t guarantee future results. The calculations don’t incorporate taxes, fees, or annualized dividend yields. Failure to exercise an in-the-money options contract can cause actual profits and losses to differ from calculated values. The maximum loss on a spread position remains limited only as long as the integrity of the spread is maintained.
Options trading entails significant risk and isn’t suitable for all investors. Customers must read and understand the Characteristics and Risks of Standardized Options. Options transactions are often complex and may involve the potential of losing the entire investment in a relatively short period of time. Certain complex options strategies carry additional risk, including the potential for losses that may exceed the original investment amount.
The hypothetical examples in this article are provided for illustrative purposes only. Actual results will vary.
Robinhood Financial doesn’t guarantee favorable investment outcomes. The past performance of a security or financial product does not guarantee future results or returns. Customers should consider their investment objectives and risks carefully before investing in options. Because of the importance of tax considerations to all options transactions, the customer considering options should consult their tax advisor as to how taxes affect the outcome of each options strategy. Supporting documentation for any claims, if applicable, will be furnished upon request.
Any content provided is for informational purposes only, doesn’t constitute investment advice, and isn’t a recommendation for any security or trading strategy.